In this fifth and penultimate article in a series devoted to the benefits of having an integration platform within an...
11 October 2024
Lire cet article en Français
Streamlit+stlite: from browser to desktop in Python using WASM

As developers, we sometimes find ourselves in tricky situations where clients need data analysis tools but aren’t too keen on complex setups or cloud-based solutions. Whether it’s the small business owner who wants to keep everything offline or the client who just needs quick insights without a bunch of hoops to jump through, having a lightweight, easy-to-share app can save the day.
Today, we’ll dive into how to create a simple data analysis web app using `stlite`, a nifty tool that lets you run Streamlit apps directly in the browser or package them as desktop applications with `stlite/desktop`. We’ll use a fictional financial dataset to keep things interesting and visualize it with some basic charts.
Why stlite?
Before we roll up our sleeves, let’s chat about why stlite is such a great tool. Traditionally, running Streamlit apps meant setting up a Python environment on a server or a local machine. But with stlite, all that heavy lifting happens right in the browser, thanks to WebAssembly. And with stlite/desktop, you can package these apps into standalone desktop applications. So, whether your client wants a web-based tool or insists on something they can run offline, you’re covered.
Picture this: a client who is adamant about keeping things offline or who needs a quick, shareable web app for internal use. Stlite gives you the flexibility to do both with minimal fuss.
Creating the Data Analysis WebApp
Step 1: Preparing the Dataset
For this example, we’ll use a fictional financial dataset representing stock prices for several companies over a given period. Here is how you can whip up this dataset in your code:
This gives us a nice, clean dataset to play with. Now, let’s move on to displaying some stats.
Step 2: Displaying Summary Statistics
Streamlit makes it super easy to display data and stats. We’ll use `DataFrame.describe()` to get a quick summary of the dataset.
That’s it! In just a few lines, we’ve got our data and some basic stats ready to go.
Step 3: Visualizing the Data
No data analysis app is complete without some visual flair, right? Let’s use “matplotlib” to create a couple of charts that show stock prices over time and their distribution.
Step 4: Deploying the App with stlite
Now that the app is ready, let’s explore how to run it either in the browser or as a desktop application.
Running in the Browser with `stlite`
- Install stlite: If you’ve read until here and still asking yourself how to install it, you didn’t follow! No need for any installation. We just need to create an html file to run the app.
For our little app, we can use this `index.html`file as a reference:
As you can see, I’ve re-used the application python code directly in the html file. I didn’t manage to import the file instead of copying the content but let me know if you ever happen to do it! By the way, you don’t need to name your files like I’ve named them, just plan accordingly if you want to rename them.
- Run the app: Load your streamlit app using `stlite`, and it’ll run directly in the browser. In other words, simply copy the `index.html` file above and open it. You can also share it as is, it’s really perfect for when you want to share your app without any server-side fuss.
Creating a Desktop Application with `stlite/desktop`
I strongly advise using yarn to install the necessary tools. npm made me lose a lot of time to no avail, whereas with yarn it was seamless. Still, I will provide commands for both tools below.
1. Create the package.json: This will hold the requirements for the application. For this app, I used this :
Here you can see a “stlite” section, this is where we can configure the application. For more details, please follow the original documentation.
2. Terminal grand opening: Basically, the few commands we’ll need to run :
- “`yarn install“` or “`npm install“` : We need to install the dependencies from the package.json above.
- “`yarn dump . “` or“` npm run dump“` è : This command creates a build directory that contains the copied Streamlit app files, dumped installed packages, Pyodide runtime, Electron app files, etc.
- “`yarn serve“` or “`npm run serve“` : For a preview of your application before building the executable.
- “`yarn dist“` or “`npm run dist“` : Final step to complete the packaging of the application in a dist directory.
The output will be a standalone desktop app, perfect for sharing with clients who prefer to keep things offline.
Since a few pictures are worth more than a thousand words, let’s see how it looks like.
When running for the first time, you get an installer window:

And the final look:

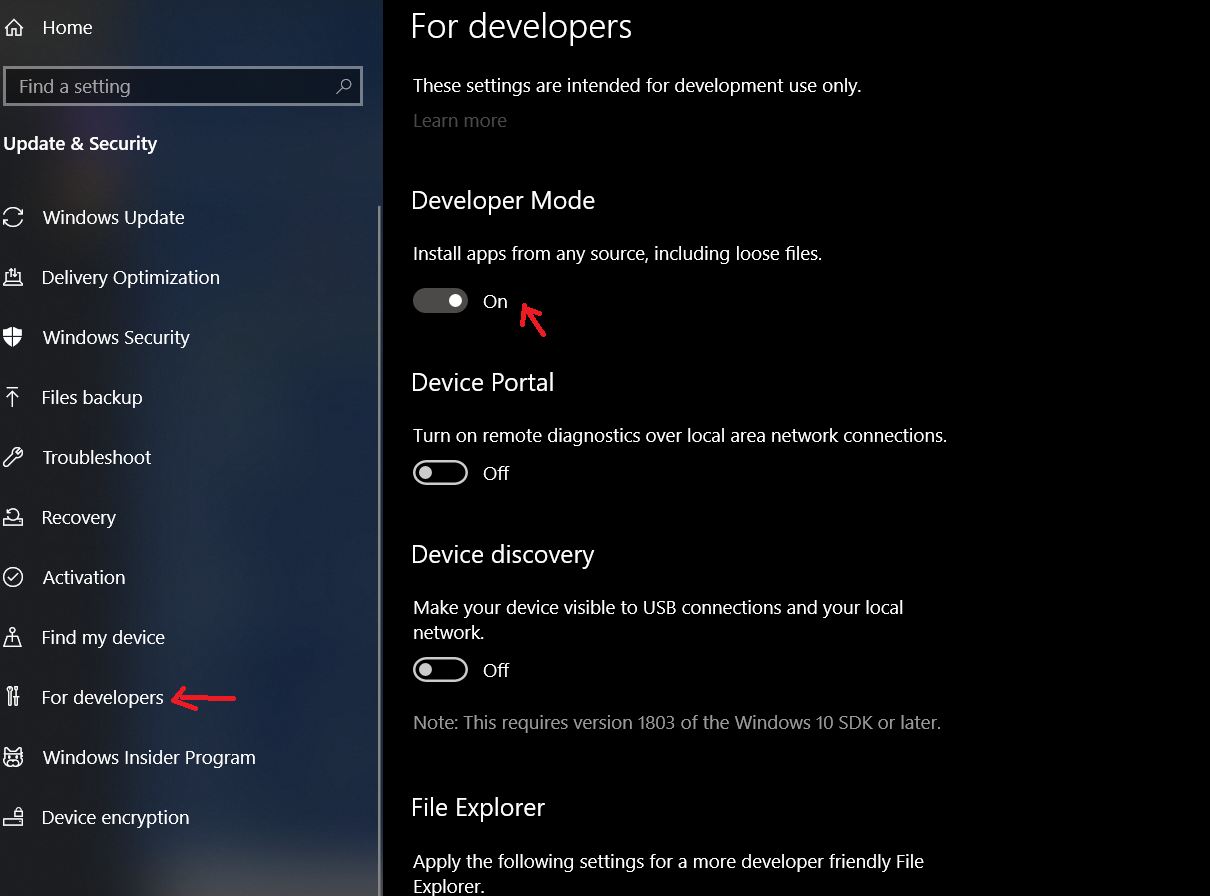
Troubleshooting
You may run into an issue when packaging the desktop application. Please make sure that the developer mode is activated if you run the commands on a Windows machine.
Takeover
And there you have it! We’ve built a simple yet effective data analysis web app using stlite.
Whether your client needs a quick online tool or a robust desktop app, stlite offers a flexible, lightweight solution. It’s the perfect way to deliver insights without getting tangled up in complex deployment processes.
So go ahead – wow your clients with a powerful, easy-to-use app that meets their needs, whether they’re online or off.
Further Reading
Do you want to know more ? Contact us!