Introduction Integrating security into a widely used platform like GitHub is both a challenge and an opportunity to enhance its...
15 November 2022
Lire cet article en Français
Monitoring in Azure: How to Automate Log Analysis and Set Up Alerts

When we develop a function or web API, we typically add logs to help us analyze errors in our code, monitor execution, and measure user behavior (connection, registration, unsubscription, etc.).
It’s common practice for only developers to have access to these logs, making them of no use to business professionals.
This post will take you through a basic technique for automating log analysis and manager notification based on use scenarios.
Azure Log Sinks
Azure has two log sinks that gather data from Azure and non-Azure apps and telemetry from Azure resources, including virtual machines, Logic Apps, Data Factory, containers, etc.:
- Log Analytics
- Application Insights
Log Analytics
Azure Log Analytics Workspace is the logical storage location for logs in Azure. It’s used by Azure Monitor to collect and store logs and by various other Azure services such as Azure Sentinel, Virtual Machine, Logic Apps, and so on.
Application Insights
Application Insights is an Azure Monitor feature that allows you to gather logs from your applications, including mobile apps, Web Apps, Azure functions, and applications hosted on other clouds or even on-premises.
Application Insights is easily integrated into various development frameworks, including .NET, Java, Node.js, and Python.
You can combine Application Insights with Log Analytics Workspace to benefit from all of the latter’s features.
How to Send the Logs?
Each component has its own configuration and log-sending method. In this post, I’ll be talking about using an Azure Function and Logic Apps.
Scenario with Web App or Azure Function
First, you’ll need to connect your code functionality to Application Insights so it can be monitored. To do so, add the variable APPINSIGHTS_INSTRUMENTATIONKEY in the settings, with the instrumentation key from your Application Insights as its value:
"APPINSIGHTS_INSTRUMENTATIONKEY" : "XXXXXXXX-XXXX-XXXX-XXXX-XXXXXXXXXXXX"
Next, install the Microsoft.ApplicationInsights package and import the following Namespaces into your class:
using Microsoft.ApplicationInsights;

using Microsoft.ApplicationInsights.Extensibility;
You then need to initialize the client that will send the logs:
You may now begin sending log events based on the use case: traces, exceptions, and custom events from your functions.
For traces:
_telemetryClient.TrackTrace($"Demo trace:function executed at: {DateTime.Now}") ;
For exceptions:
_telemetryClient.TrackException(new Exception($"Demo trace : Timer trigger function executed at: {DateTime.Now}"));
For CustomEvents:
Scenario with Logic Apps
To use Logic Apps and other Azure services, link them to the Log Analytics Workspace. For more details, I recommend reading Microsoft’s post on Log Analytics.
If you use an ARM Template to deploy your Logic Apps, all you have to do to begin collecting monitoring data is add the DiagnosticSettings resource. Then, enable the categories you’re interested in, as shown below.
You can use the Azure Log Analytics Data Collector connector to send custom logs to Log Analytics. This connector has two settings:
- JSON Request body: lets you send data as a JSON object.
- Custom Log Name: lets you specify the name of the table where the logs will be stored. If the table doesn’t already exist, it will be created with the suffix _CL. For example, if the value is “Bootcamp,” the created table will be called “Bootcamp_CL.”

To retrieve these logs, run a query using the table name in the Log Analytics Workspace editor.

How to Set Up Azure Alerting?
We can set up our alerts now that the logs have been uploaded to Azure.
Preparing the Query
First, we have to prepare the query that will return the result for the type of logs we want to monitor (for example, exceptions, warnings, or functional data stored in a CustomEvent).
Navigate to the Logs tab of Application Insights or Log Analytics in the Azure portal. You can run queries in the query editor. For example, to select exceptions generated in the last 24 hours, use the following:
exceptions

| order by timestamp desc

| count

Action Group and Webhook
When all the conditions for raising an alert are met, Azure uses the action groups component to notify users by email or SMS and/or push a notification to another component using a Webhook, such as an Azure Function or Logic Apps.
If you choose an Azure Function to receive the notification and customize the message, all you have to do is send an HTTP request to the target (Teams, Slack, Jira, etc.) with the message based on the schema provided by Microsoft (alerts-common-schema-test-action-definitions).
The following code shows an example when sending to Teams:
You can use Logic Apps if you prefer less code, as shown in the example below:


Creating the Alert
Go to the Logs tab of Application Insights and create an Alert Rule:
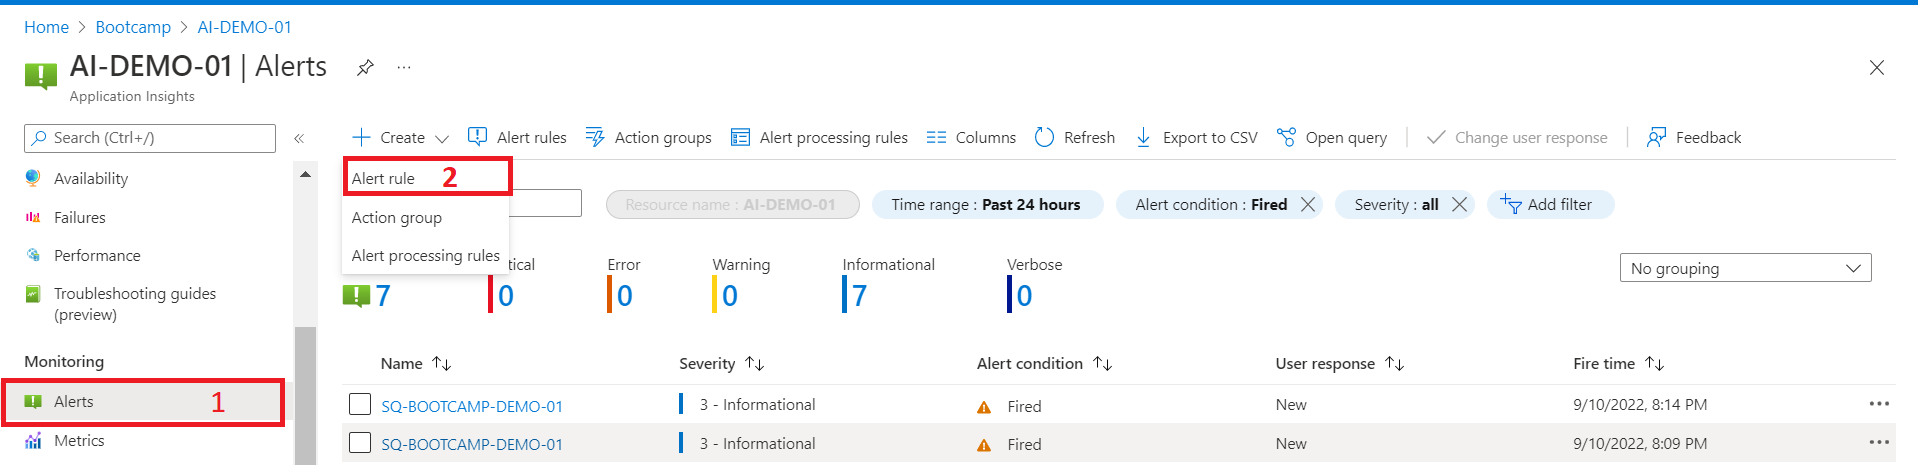
Choose Custom Log Search from the list of signals, then type in your query and confirm.
Next, you can configure the search window and the alert analysis frequency.
For example, analyze the query daily and retrieve the logs for the previous 24 hours.

Select the action you just created in the Action tab: AG-bootcamp-01.
Finally, select the Resource Group, alert name, description, and severity in the Details tab.
Result of Creating the Alert
Now that our alert is set up, as soon as the conditions defined in the query are met, we should receive a Teams alert with a link to view the logs:

Expand Your Knowledge of Azure Monitoring
In this post, we discussed a straightforward and low-cost method of monitoring functions and other components in Azure without inundating users’ inboxes with alerts that are likely to be ignored or filtered.
Please read our earlier post on workbooks if you prefer to use reporting tables.