Introduction Integrating security into a widely used platform like GitHub is both a challenge and an opportunity to enhance its...
2 November 2022
Lire cet article en Français
Azure Workbooks: Azure’s Integrated Dashboarding Tool

Cellenza’s experts are increasingly tasked with monitoring the activity of the ecosystem’s components during their various assignments. In response to this requirement, Microsoft has incorporated various features, including Workbooks, which allow you to create or use dashboard templates that show the platform’s activity.
This post will use API monitoring in the context of Modern Integration to show how this module works. We’ll look at what Workbooks are and how we can quickly set up consistent monitoring of the platform’s key indicators using Microsoft templates. Lastly, we’ll look at how we can interact with these reports.
What Are Azure Workbooks?
Workbooks are a dashboarding solution built in Azure by Microsoft to meet technical and functional component monitoring requirements. They provide flexible and interactive templates that adapt to the monitoring requirements of each Azure platform.
They allow indicators from several data sources to be shown in the same report, such as Application Insights, Azure Monitor, Log Analytics, Azure Resource Graph, etc. You can keep track of the most important indicators in the same report thanks to the different display options:
- text
- parameter settings
- analytics requests
- metrics
We’ll see how, with the help of Microsoft’s templates, it’s easy to get a quick overview of the system’s activity across all its components. This dramatically cuts down on the time it takes to roll out monitoring reports, particularly technical ones.
Microsoft Workbook Templates
Let’s use the activity reports available in the Applications Insight feature that allow the monitoring of Azure application activity, to demonstrate how Azure Workbooks can be used.
You can find the Workbooks in the Monitoring section. You can also see all the report templates customized for the component they are integrated into.

Here, we are monitoring the activity of an API App that controls the integration platform APIs.
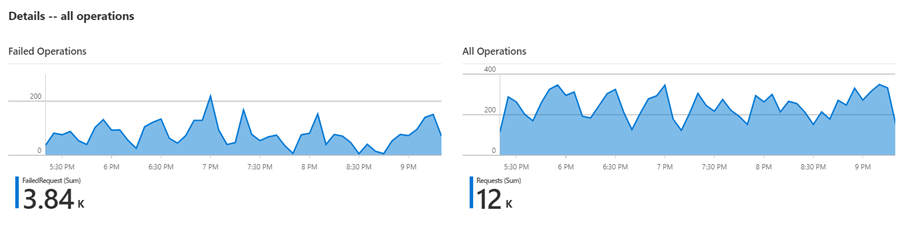
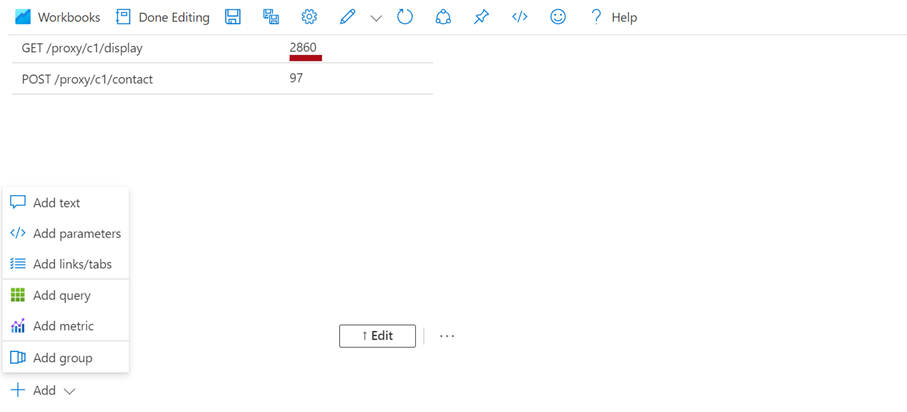
We use the reports provided by Microsoft, such as the failure reports, to make our platform more resilient and to detect and quantify errors. We can see the activity of our platform’s various APIs and the percentage of success for each, as shown below.

In addition, we can see the distribution of errors over time in connection with the platform’s activity:
We can also monitor platform performance through reports. For example, we can find out how reliable an API App is and how often and for how long it has failed.

Now that we’ve seen the different kinds of reports Microsoft offers, we’ll look at how we can interact with them and share them with teams other than the one managing the platform.
How Do We Interact with the Reports?
The reports we looked at above have the benefit of being fully interactive and can be tailored to specific monitoring requirements.
You can choose how often the data is updated or use the parameters built into the reports to change how often the indicators are shown.

You can use Query Analytics to add missing content or important indicators—like metrics or analytics—to these reports to meet individual needs better.
You can also change a query in your report to add any missing information. The downside is that this requires a basic understanding of the Kusto SQL query language. For this reason, this feature is geared more toward tech-savvy or other key users.

You can also share these reports. Simply share the direct link to the report while maintaining control over the attributed rights: Contributor or Read Only with role-based access control (RBAC).

Custom Workbooks
You can also create fully customized Workbooks by starting with a blank template and populating it with the most relevant customized indicators for your required monitoring. We’ll be exploring this option in more detail in a future post. Watch this space!
Azure Workbooks: Key Takeaways
Azure Workbooks, as we’ve seen in this post, are reports that are directly integrated into the Azure portal and are quick to set up thanks to pre-existing templates.
These templates are adapted to the Azure component they are integrated into, allowing you to create interactive activity reports that can be shared within the team(s) responsible for keeping the Azure platform healthy. With just a few clicks, you can obtain dashboards that provide an interesting overview of the platform’s activity and health.
In this post, we demonstrated how simple it is to implement a reporting strategy for the Azure platform’s activity and health with minimum time to market.
In the case of Modern Integration, these templates also provide a clear picture of the platform’s activity by giving an overview of flows, performance, and errors. In addition, because these reports are clear and can be easily distributed to other teams, they help break the “black box” effect that some integration platforms can have.
Want to find out more? Help is on hand from our experts: contact us!