Minimal APIs were released at the same time as .NET 6, C# 10, and a number of performance improvements. But...
6 May 2021
Lire cet article en Français
NDepend: 3 Uses to Make Life Easier for Developers

If you’re a .Net developer, you have no doubt heard of NDepend. If you haven’t yet had a chance to check this tool out, I’m here today to show you why I think NDepend is an amazing everyday tool for your projects.
Use No. 1: Identify Code Structure
We’ve all been there: you get started on a new project and you’re faced with hundreds of files in dozens of projects. Thousands of lines of code that all look the same! So, what do you do? Take a project with a familiar name – personally, I look for “.core” or “.data” projects since these are often the most referenced projects and I have more chance of finding abstractions to help me understand what is going on – and start navigating through the source code. It’s not so easy to keep track, right? It’s a bit like finding your way through a maze without a map. You get there but not efficiently.
Enter NDepend to help me out. I’ll be using the Orchard source code throughout this post to show examples. When I open the solution in NDepend, this is what I see: a map of the source code:

There is a filter which, by default, allows you to exclude third-party DLLs (Dynamic Link Libraries) (in other words all DLLs not generated by the solution):

After disabling that filter, you can see the .Net framework DLLs and navigate through them as if they were your code:

Each “box,” e.g. “OrchardCore.Users” is an assembly. The arrows show us dependencies between the projects.
But NDepend doesn’t stop there: to help you understand the project, NDepend also creates clusters. Within these clusters (4 on this diagram), you have projects with roughly the same dependencies. This diagram is completely interactive. I can select a project and view its dependencies.
Let’s start with the Orchard.Core project:

All the projects that depend on this project directly are shown in green. It’s pretty logical: it’s like a central project. I can see, in blue, that it is dependent on two other projects:

Let’s go to “OrchardCore.Abstractions”:

Everything is logical, this project is not dependent on anything. It is, however, used almost everywhere. So, now I know that to work on this project, I need a good understanding of what is going on inside. Now I’m in this project, though, where should I go next to continue investigating? I’m going to use a different view, a matrix view that will help me understand the links between the projects better:

Each box indicates the number of times the project is used by another project. That helps you understand the interdependencies better. The higher the number, the more projects are connected.
In this example, I used a breakdown by project but I could also have used a breakdown by namespace. This can be more useful once you’ve figured out how the source works.
Use No. 2: Code Analysis
Now you know how to navigate, it’s time to delve deeper into the code and analyze it. NDepend provides an analysis of the code right from the solution’s dashboard:

On the left are the classic analyses: code size, number of files, and namespaces, etc. Already, that gives you an idea of how the code is organized.
Further right, there are analyses you will be familiar with if you use SonarQube:
- rules with anomalies
- a technical debt score
Like any other code analysis tool, NDepend also lets you monitor changes in these indicators over time using snapshots. These analysis snapshots can be taken at the time of the build, which allows you to check “quality gates,” for instance, and generate statistics to identify a general trend. NDepend can also include code coverage results in its analysis tools to supplement these analyses.
Let’s come back to debt in a moment. Let’s look at the rules first:
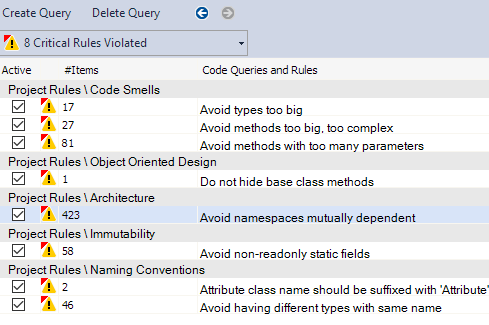
Let’s take a look at the “Avoid types too big” rule. It is quite significant, and often a source of controversy: after all, you need a threshold to say that a class is too big, but what should it be?

All of NDepend’s basic rules come with an explanation but they are completely customizable. Go to “View Source Code” to see how a rule is constructed:
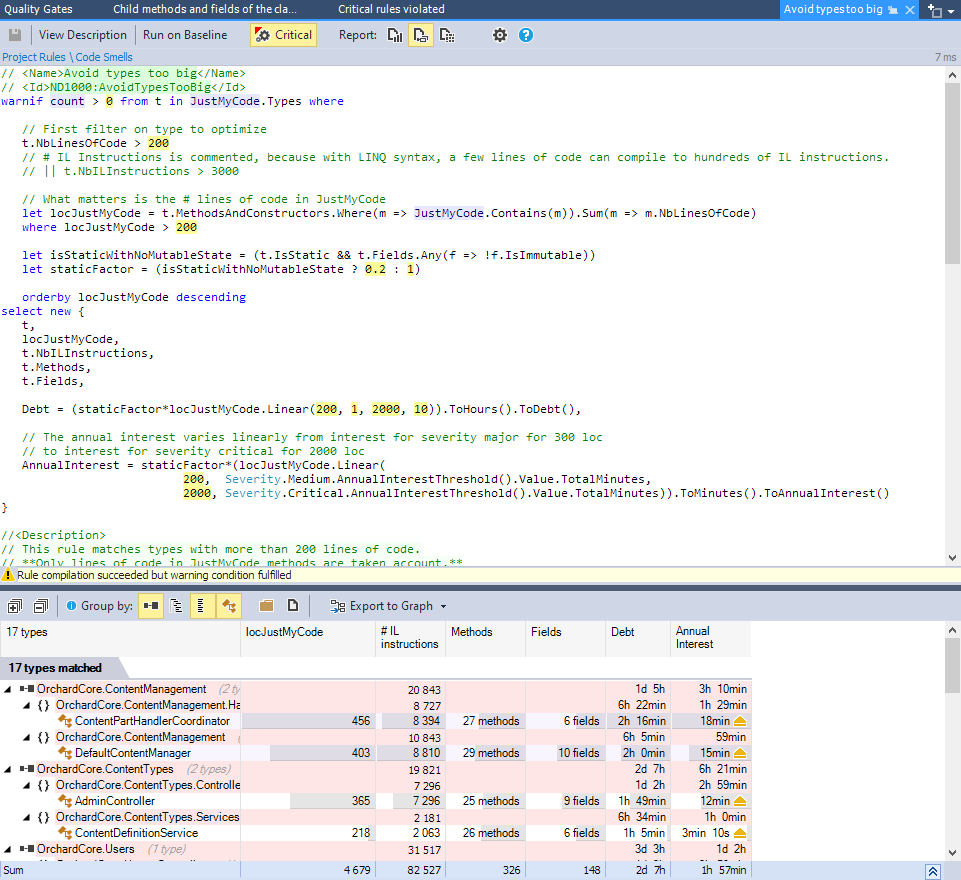
This will be extremely familiar if you are a C# developer. A rule is a bit like a LINQ query in data. The data happens to be from the structure of your application. Like a rule, it is essentially code. You can copy it and modify it to make it into a different one.
Here is an idea of the type of rules I often add to my projects:
- When I use dependency injection, I prohibit use of the concrete class except when I am building my injection container.
- I have previously had date problems in my projects where developers have used the local date by mistake. Using a rule, it is easy to check that the “DateTime::Now()” method is never called.
- I have objects with sensitive data (date of birth, etc.). I can use a rule to detect use of those throughout the codebase.
NDepend is the database for the structure of your application.
Use No. 3: Measure the Quality (of my Code) and Devise a Plan of Action
Adding features and fixing bugs is key. The “cleaner” the code for software, the simpler it is. Without going into detail about the maintainability of a source code, it is often linked, among other things, to:
- its test coverage
- its ability to be modified locally without affecting the entire source code
- organization of the code (rough methods, interactions between the classes)
NDepend analyzes this type of information. Based on rules, we can provide theoretical turnaround times for fixing anomalies. Based on these times and using regular snapshots, we can also see if the overall quality of our software is improving or deteriorating.
In NDepend, this fix time is called our “debt.” Via the dashboard, we can see all the queries causing the debt to rise:
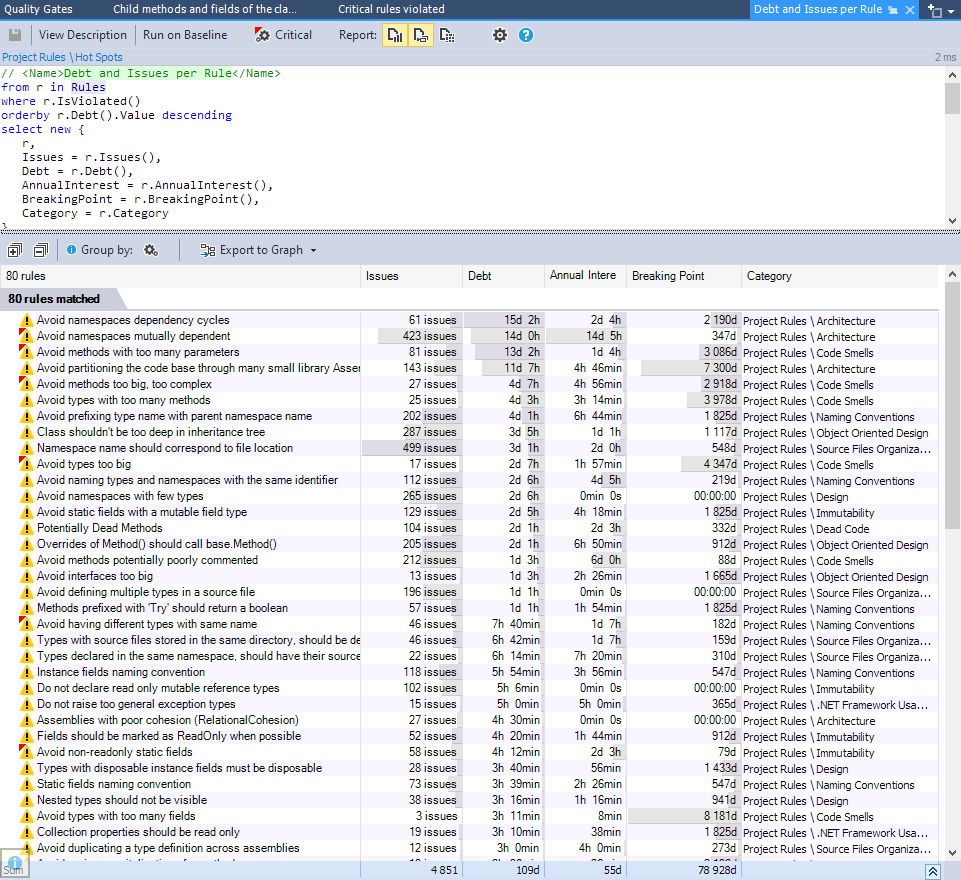
Note: these are NDepend’s basic rules. They can be completely customized and adapted to your software. Four details are shown for each item:
- Number of times the anomaly occurs
- Cumulative debt
- Annual interest
- Breaking point
The first two are fairly obvious but the latter two need some explanation. These elements will help you prioritize your code improvement efforts.
Let’s start with annual interest. As with any debt, a quality defect has to be paid for. The annual interest for a rule represents the cost in terms of development if the anomalies are not fixed. In “Instance fields naming convention,” for example, the anomalies make the code harder to read so it takes longer.
As for the breaking point, that’s fairly straightforward once you understand the interest. Let’s look at the same rule again to explain. 5 hours and 54 minutes of work are estimated to fix the errors with an estimated 3 hours 56 minutes of lost time per year. The breaking point tells you that, after 547 days, you will have lost as much time because of the debt as if the errors had been fixed, in other words, 5 hours 54 minutes. This means you are wasting time trying to fix errors after this breaking point (since you have to spend the debt anyway to fix the issue).
This means that, with an equivalent severity level, it is best to fix anomalies with a shorter breaking point. For example, I am not about to fix the “Avoid types with too many fields” rule since the breaking point is in over 8000 days.
To sum up the criteria for determining the fix order:
- The most critical anomalies first
- Those with a small breaking point and large interest
Don’t forget you can then use the history function to monitor fixes and, later on, to maintain debt within reasonable limits.
One last tool to help you: NDepend also includes a SQALE indicator that provides a general rating and the cost to improve the rating. Managers are usually fans of indicators like this.