In this fifth and penultimate article in a series devoted to the benefits of having an integration platform within an...
29 March 2022
Lire cet article en Français
OpenTelemetry: .NET Instrumentation in the Future
If you have developed your services in .NET C# and decided to deploy them on Azure, you will undoubtedly need observability to deal with potential production issues. By monitoring production, you can improve your service and learn more about your customers’ habits.
There are many solutions on the market today that meet these needs. This post will focus on the native Azure Monitor tool and examine its future through the OpenTelemetry initiative.
Monitoring .NET Services
With Azure Monitor through Application Insights, the.NET ecosystem now has mature and high-quality instrumentation tools.
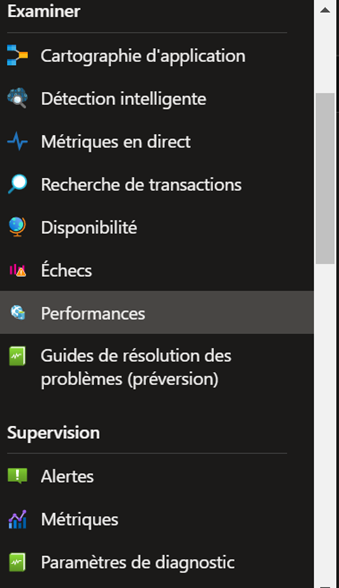
For example, after setting up your Azure Monitor resource and getting the necessary configuration elements, you install the Microsoft.ApplicationInsights.AspNetCore package in your Asp.Net Core application. Then, you configure your application with the Application Insights configuration key generated when you installed your Azure Monitor resource, so it has all the elements necessary for your Azure Monitor resource to collect telemetry data. You can see what is going on very quickly: real-time traffic, a list of completed transactions, etc.
Read our post on the Azure platform native Run tools to learn more.
Application Insights is an Azure Monitor tool that allows you to monitor and collect performance indicators to improve service usage and debug production problems.
It’s a mature solution that automatically provides a set of telemetry data without additional code: examples include integration with tools such as EntityFramework and support for the well-known “HttpClient” HTTP request/response feedback. You can also add what you need. For example, if you have multiple instances of a service running in a distributed environment, you can add information to specify which instance handled an operation. Although this post focuses on .NET, Application Insights also supports Java and NodeJS.
Distributed architectures have been increasingly popular in recent years due to availability and resilience concerns, but they inevitably result in greater complexity in the implementation and operations. Because of these problems, the concept of observability has gained traction. Traditional monitoring is based on two assumptions:
- Engineer teams can predict telemetric indicators of interest for operational needs
- The indicator alone can help you understand the cause of a problem
These two assumptions are no longer valid in a distributed environment: the number of interactions between services has grown exponentially, and even a straightforward service can interact with multiple data stores. It’s no longer feasible to wait for an alert to determine when or where to intervene.
Traditional monitoring cannot determine a service’s behavior. Observability can. Tools on the market have evolved in recent years to fulfill this need. New tools have emerged that focus on observability.
Furthermore, as a .NET developer, you will need to integrate another library to instrument your application elsewhere, such as locally or through a monitoring tool. In addition to the situations above, not having access to a sufficient level of monitoring of an infrastructure element via Azure Monitor (because it isn’t compatible with Application Insights) causes issues.
In other words, how can the need for observability across the maximum number of ecosystems be addressed without a strong dependency between the telemetric data collecting and monitoring solutions?
This question is critical considering the .NET ecosystem’s recent shift towards open source in the last five years or so. It is, therefore, important that open source tools like Jaeger and Zipkin and commercial products like Honeycomb and Datadog support .NET just as well as NodeJS, Go, and Python.
This is equally important in the Azure Monitor environment since it allows you to provide your service with the fewest possible constraints in terms of the development technology used.
The Azure Monitor team has finally responded to this issue, declaring its desire to join the OpenTelemetry initiative. As we’ll see later, this announcement also benefits the .NET ecosystem.
What Is OpenTelemetry?
OpenTelemetry is a set of tools, APIs, and SDKs for collecting and using application telemetry information for several ecosystems (.NET, Elixir, JavaScript, etc.).
The following telemetry model is defined within a specification:
- Metrics: used to measure something within a service. Metrics can tell you the request processing time or latency rate. They are time-stamped and can be linked to metadata such as the address of the service instance from which the measurement was taken or the service uptime, for example.
- Logs: a log is dated information about what is happening in your system. A log can be a simple text or an event. This is referred to as a structured log in the case of an event. Generally, the log reports a change in the system state or other significant event.
- Traces (Distributed Tracing): allows you to track a request’s progress through all of your system’s services. In a microservice context, a trace allows you to track an incoming request’s progress in your system and the child requests it generates. This is not to be confused with “Traces” in Azure Monitor, which are actually logs.
This specification also defines other elements. The following concepts are particularly important for the purpose of this post:
- Instrumentation library: this is a software library that provides instrumentation for a third-party library. This allows for a more comprehensive level of observability by enabling you to observe the project’s dependencies.
- OpenTelemetry client (or SDK) is the dependency that your application uses to set up traces, metrics, and logs using the OpenTelemetry model. Software development kits (SDKs) are available for a wide range of ecosystems, including.NET, C++, and Python.
- OpenTelemetry Exporter allows data to be transmitted to a specific backend such as Azure Monitor, Jaeger, or Prometheus. It, like the SDKs, is available for a wide range of environments.
- OpenTelemetry Collector also enables the collection and transmission of data to a specific backend. The difference with an Exporter is that the latter performs this operation through an agnostic protocol (OpenTelemetry Protocol – OTLP). If you do not want to include a dependency on a specific backend in your application and/or you wish to use multiple monitoring backends, Collector will suffice. It has two modes of operation:
- Agent mode, which is embedded in the application
- Collector mode, which is a separate service
Finally, it’s worth noting that this program is backed by the Cloud Native Computing Foundation (or CNCF), which also backs projects like Kubernetes, Helm, and Prometheus.
To summarize, by implementing OpenTelemetry, Azure Monitor can be used by a wider range of technologies with less effort. Similarly, .NET benefits from integration with other monitoring platforms at no extra cost.
Azure Monitor, .NET & OpenTelemetry Today
At the time of writing this post, Azure Monitor officially supports OpenTelemetry traces in the Java, .NET, NodeJS, and Python ecosystems via “exporters” running within the target applications. However, some initiatives employ the agent-based approach using the OpenTelemetry Collector. See the official Microsoft documentation for more information.
The Azure.Monitor.OpenTelemetry.Exporter package, currently still in beta, provides support for OpenTelemetry to Azure Monitor in .NET. However, it should be noted that several important .NET and .NET Core key component instrumentation libraries are in the release candidate stage and are extremely active. Exporters for other platforms like Jaeger and Prometheus are also being developed.
While it’s still too early to utilize OpenTelemetry in production in .NET or Azure Monitor environments, it’s critical to evaluate and research this project to put it into production in 2022 for projects requiring state-of-the-art observability. For those projects that are happy with the status quo, it’s still crucial to follow this project because instrument libraries and suppliers will soon focus their efforts on this initiative for all the reasons stated in this post.
Along with the public cloud giants, observability solution publishers are adopting OpenTelemetry. In 2022, software professionals simply cannot afford to ignore these changes in the “new” standard.
Interested in finding out more about how Build impacts the Run? Listed below are all the posts from this series in partnership with Squadra:
- 12 Factor-App: Modern Application Development Patterns
- How to Keep a Kubernetes Platform Up and Running
- Kubernetes: Building a Platform with Run in Mind
- Azure’s Native Run Tools
- AI Project Run: Managing the Life Cycle of an ML Model
- Data Observability
- Which Metrics Should You Be Tracking for your Mobile Application?