Introduction Integrating security into a widely used platform like GitHub is both a challenge and an opportunity to enhance its...
8 March 2022
Kubernetes: Building a Platform with Run in Mind

Post co-written by Benoit Sautière (Cellenza) and Sébastien Dillier (Squadra)
Kubernetes is a complex ecosystem that takes time to develop and manage. This is a subject that Cellenza explored during the Container Month in June 2021. This ecosystem (the Azure Kubernetes Service – AKS) platform, the technical services we associate with it, and the peripheral Azure services) must be designed with its future operation, often known as the “Run,” in mind. To avoid rebuilding before going into production, it’s better to make the right choices from the start. This platform’s construction must achieve several predetermined goals (resilience, availability, etc.). We still need to formulate them.
What Are the Objectives of Our AKS Platform?
The applications we host on our Kubernetes platform specify its requirements. Businesses have to determine the value of their applications. A highly visible customer-facing application that generates income is considered vital to the company. For a business, the unavailability of such applications is a risk that our future AKS platform must be equipped to handle. The Kubernetes platform is built around these goals, which we’ll turn into commitments.
As the platform’s future operator, we must commit to its availability and resilience. All Azure services have Service Level Agreements (SLAs). These Microsoft contractual commitments will be used to calculate the SLA for the Kubernetes platform we use to host our applications.
By default, Azure Kubernetes Services pledges a Service Level Objective of 99.5%. However, this is an objective, not a commitment. Microsoft commits to 99.95% service availability for the AKS service (Azure Kubernetes Service Uptime SLA). Despite these figures, we must not forget that unavailability does still happen.
The table below shows the acceptable downtime according to the SLA level selected by businesses:
| SLA | Annual downtime | Monthly downtime | Weekly downtime |
| 99% | 3.65 days | 7.20 hours | 1.68 hours |
| 99.5% | 1.83 days | 3.60 hours | 50.4 minutes |
| 99.9% | 8.76 hours | 43.2 minutes | 10.1 minutes |
| 99.95% | 4.38 hours | 21.56 minutes | 5.04 minutes |
Note: to maintain this level of commitment, you also need to consider the availability of the teams in charge of the Kubernetes platform. Humans are the first to respond to an incident. A decision must be made within an acceptable timescale, even if the response is automated (automatic failover to another Azure region, rebuilding the platform in another region, etc.). In France, providing a continuous service (24/7) requires at least seven individuals for each role on the platform’s operating team. This is a crucial aspect to keep in mind.
Which SLA for Our AKS Platform?
The availability of our infrastructure cannot be measured solely by the availability of its most critical component. With Azure Kubernetes Services, each component has its own SLA. This is known as a composite SLA. As seen in the diagram below, AKS is a complex ecosystem, and computing the composite SLA is no easy task.

AKS architecture – detailed view
Without delving into the complex architecture involving multiple Azure regions, the unavailability of one of these components will invariably impact our Kubernetes platform and, potentially, the apps it hosts. This brings us to the concept of resilience.
AKS: Resilient by Design
Building a resilient platform involves making choices. Kubernetes is a complex and distributed system. The consistency, availability, and partition tolerance (CAP) must be addressed when building a resilient system. However, a distributed system can only deliver two of the three desired characteristics, according to the CAP theorem. As a result, there can never be a perfect AKS platform. Now we have acknowledged this, let’s look at the multiple levels of resilience that Azure Kubernetes Services can provide:
- Control plane level: These are the cluster nodes that manage our AKS cluster. Microsoft hosts them for us for free. At this level, we can either accept Microsoft’s default SLO of 99.5% or activate the Uptime SLA option, which guarantees us an SLA of 99.95%. Since the AKS control plane is free, Microsoft cannot guarantee its availability. This option can be added to an existing cluster.
- Azure region level: AKS is a regional service, so it’s linked to an Azure region. The use of virtual machine scale sets at this level allows us to distribute its instances across the region’s multiple availability zones. The Kubernetes control plane will detect the unavailability of instances hosted in an availability zone and ensure reconstruction of the failed nodes. Unavailable instances reduce our ability to host applications. We can either overestimate the number of instances required or accept temporary unavailability while the failed ones are replaced.
- Node level: The Kubernetes control plane detects node failure when they report a “NotReady” status for ten consecutive minutes or when they do not report any status at all during that time. Again, the Kubernetes control plane will detect the situation and ensure the failed nodes are rebuilt. Our applications may be unavailable during this period due to reduced hosting capacity (CPU/RAM). Adding an additional node to the Kubernetes pool is always a smart idea to prevent or reduce this risk. While this is undoubtedly a financial cost, it should be considered insurance. This additional node will be needed anyway to manage cluster upgrades.
- Pod level: Resilience with the notion of “ReplicaSet” is determined at this level by the nature of our application. We have declared our application as a “Deployment ” in Kubernetes. We can express the number of instances for each of our pods using the concept of “ReplicaSet.” The Kubernetes control plane ensures that the number of replicas we request is correct throughout the application’s life.
Azure Kubernetes Service is designed to be resilient on multiple levels. An Azure region-scale service unavailability is the only risk the platform cannot natively address. Fortunately, such incidents are rare. If the business decides that we need to be able to handle this type of situation, a “multi-region” infrastructure that allows applications to be switched between regions will be needed.

Multi-region AKS architecture – simplified view
It’s relatively simple to have the same capabilities in a second Azure region because it boils down to providing the same hosting capabilities in a second Azure region. The storage and database services required for our applications are where things get more complicated.
Resilience of Our Backing Services
The first post in this series discussed the concept of backing services. We need to apply the same standards to these as to the Azure Kubernetes Services. There is no storage, no databases, and our applications cannot operate without them. It’s technically possible to consume Azure services in another region in a “multi-region” scenario. This solution requires us to accept increased bandwidth consumption costs and is only feasible if our applications’ performance is not too adversely affected. However, this solution fails to take into account the possibility of our backing services becoming unavailable. This leads us to consider the risks we might face:
- Local service unavailability within the region
- Regional service unavailability
Depending on the backing services we use in Azure, they may be able to help us reduce these risks (there is no such thing as zero risk). The table below summarizes how Azure’s main services can address these risks.
| Azure Service | Local unavailability | Regional unavailability | Failover strategy |
| Storage Account | Zone-redundant storage (ZRS) | Read-Access Geo-Redundant Storage (RA-GRS)
Read-Access Zone-Redundant Storage (RA-ZGRS)
|
Storage Account Object Replication (Blob)
|
| Azure SQL Database | General Purpose service tier zone redundant availability | Active Geo-replication | Auto-Failover Groups |
| Azure Database for MySQL | Zone-Redundant HA architecture | Azure Database for MySQL Read replicas | Geo-Restore
|
| Azure Database for PostGreSQL | Zone redundant high availability architecture | Azure Database for PostgreSQL Read Replicas | On-demand failover |
| Azure CosmosDB | Continuous Backup | Distribute your data globally with Azure Cosmos DB | Configure multi-region writes in your applications that use Azure Cosmos DB |
| Azure Cache for Redis | Zone redudancy | Geo-Replication
|
Failover and patching for Azure Cache for Redis
Configure geo-replication for Premium Azure Cache for Redis instances |
Each of these Azure services can provide us with solutions to solve local or regional service unavailability. Our challenge will be to ensure data consistency across multiple services while minimizing recovery time for our consumers. Developing this level of resilience means being prepared for and anticipating the worst-case scenario.
Be Prepared for Incidents
Increasing the availability and resilience of our AKS platform makes this more complicated, as do the incidents we need to manage. This entails preparing for a variety of scenarios (full or partial infrastructure unavailability) and practicing how to respond. From a business perspective, we need to determine our objectives:
- How quickly should I be able to get the service back up and running?
- How much data loss is acceptable to consumers?
Setting up a recovery time objective (RTO) is the answer to the first question. Meeting this objective mainly involves investing in different areas:
- Industrialization: of infrastructure deployment (with Terraform) and application deployment (with Helm/Kustomize).
- Identify our platform’s failure to perform a preventive, not reactive, failover. This entails gaining a thorough understanding of our Kubernetes platform through observability.
- Testing: We must test our procedures against incidents to ensure that we can still meet our RTO commitment.
There is a risk of data loss when we switch over our infrastructure. Azure provides synchronous synchronization for zone-redundant storage (ZRS) within a storage account, ensuring the consistency of our data within the Azure region. The replication will be asynchronous as soon as we replicate our storage account in another Azure region using geo-zone-redundant storage (GZRS). The consistency of our data can therefore be jeopardized at any time. We have been able to initiate switching our storage account since mid-2020.
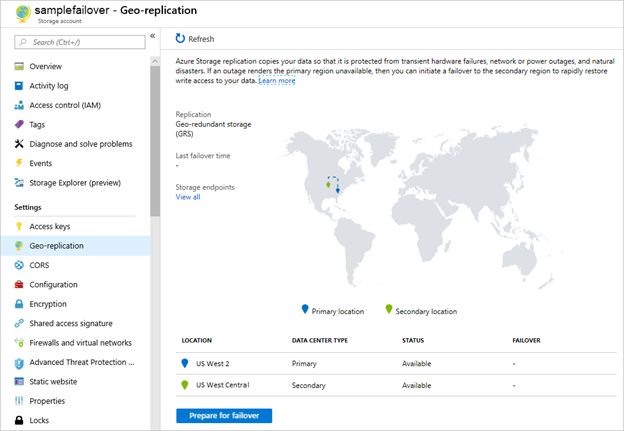
Manually switching storage accounts between two Azure regions
We now have object replication for block blobs, which allows us to replicate data between two different storage accounts. Our goal is to reduce the risk of data loss, or at the very least, to reduce application downtime. This is the recovery point objective (RPO).
Building Our AKS Platform
An AKS cluster consists of compute instances (nodes) organized into groups (pools) that host our pods. We distinguish between “system node pools” and “user node pools.” The system node pool is designed to isolate a number of technical pods required for Kubernetes to function properly (CoreDNS, etc.). The “node affinity” mechanism ensures that these technical pods are placed in this system node pool as a priority. The system node pool should have at least three nodes that the virtual machine scale set can distribute among the region’s three availability zones to ensure resilience. The cluster is not jeopardized if one of the three nodes is unavailable. Finally, a Kubernetes upgrade will always require at least one additional node. This upgrade requires at least one surge node.
We can choose the right virtual machine size by introducing one or more user node pools. When used in conjunction with a mechanism known as “Taints and Tolerations,” Kubernetes allows you to create an affinity link between a specific user node pool (e.g., virtual machines with GPU) and pods, allowing you to prioritize the use of these virtual machines for pods that do not require their capabilities.
The capacity of each user node pool to host pods is limited by CPU power and memory. Therefore, increasing the number of instances allows us to expand our hosting capacity. We must consider each pod’s CPU and memory requirements, and the number of replicas declared within each “Deployment” when sizing our cluster. The total number of pods is important because we must not exceed the maximum number of pods that can be instantiated per node. This limit is set when the node pool is created. Note: the default value is different depending on whether our cluster is deployed using Kubenet or CNI. A too low limit can result in the CPU/memory capacity of the nodes being underutilized, requiring more nodes than are actually needed. We know how many nodes will make up our user node pool at this stage. Now the question is: if I lose a node, will the remaining nodes be able to host all my applications? If the answer is no, you know you are missing at least one node in your user node pool to address the risk of losing cluster capacity.
Finally, the number of nodes that make up a pool does not have to be fixed. It can be made dynamic by configuring the Cluster Autoscaler function. The AKS cluster detects when the control plane cannot deploy new pods due to the constraints. The cluster will then increase the number of nodes in the pool automatically. This feature is also available at pod level, where metrics determine the number of pods needed for proper operation (Horizontal Pod Autoscaler).

Cluster Autoscaler and Horizontal Pod Autoscaler
Life Cycle of a Kubernetes Platform
Kubernetes is a living product. Since July 2021, the Kubernetes development community has followed a cycle of three major releases per year. Each new release comes with new features and security updates. Only three major stable releases are supported by Azure Kubernetes Services, according to the support policy. This means that you will not be able to upgrade AKS clusters older than a year. The importance of this should not be overlooked. The Kubernetes platform we are building includes an entire ecosystem that will need upgrading. We have two options for dealing with this:
- Upgrade
- Rebuild
Upgrade Strategy
Azure Kubernetes Services makes keeping our clusters operationally ready and upgrading them easier. From an AKS standpoint, this technical process eventually becomes a non-event. However, we still need to ensure that the ecosystem we are installing is working properly and that the applications are not experiencing any regression. Some APIs may be deprecated with a new release. These changes are announced ahead of time, so that we can prepare. AKS handles the upgrade process, making it industrialized from start to finish. We can upgrade the control plane, a pool, or even node by node if necessary. AKS will technically isolate each node (cable and drain) to force pod redeployment on other nodes. The node is then replaced with a new one. This can take a long time if the cluster has to redeploy numerous pods. The main problem with this method is that we do not know how long the operation will take. As a future operator, this method prevents us from committing to a maintenance window. Finally, it means that all the businesses that own the applications must agree on a single date to perform this maintenance operation.
Rebuild Strategy
The Rebuild strategy entails building a new AKS platform alongside the existing one to facilitate a phased application failover. This method checks our ability to rebuild our Kubernetes platform and, therefore, that we can meet our recovery time objective (RTO). This strategy does not require the simultaneous failover of all applications, but it does necessitate extra care for the failover of backing services.
What Indicators Should Be Monitored?
Monitoring our Kubernetes platform provides us with a variety of health indicators. We need two types of indicators if we are responsible for operation:
- Capacity indicators
- Situation indicators
The first indicator type should confirm that our platform’s sizing allows us to meet the needs of the hosted applications even under peak load. The second type focuses on the applications.
Capacity Indicators
Our platform’s availability is the first indicator to track. Kubernetes uses the concept of condition to track the status of each node. This indicator allows us to detect unavailable or memory-hungry nodes quickly and efficiently. This information is important because the cluster may be unable to instantiate pods with one less node. Our cluster’s capacity is restricted by the size of the virtual machines and the resources they provide (CPU, memory). The Cluster Autoscaler function can boost cluster capacity but not instantly. The feature is only activated when a deployment fails, indicating that our platform could not meet the application’s requirements. So pushing the boundaries is not an option. It’s better to predict demand if we know when our applications will be busy.
The number of pods instantiated per node is a second capacity indicator to track. This number is limited at the node pool level. Whether our cluster uses the Kubenet or CNI network stack determines the default value. Kubernetes will refuse to instantiate pods on that node once this limit is reached. Too low, and we lose resources (CPU/memory). The problem is that this value cannot be configured until the node pool is created. This indicator, like CPU or memory usage, determines the hosting capacities.
Situation Indicators
In terms of situation indicators, the first one that we’ll look at is the status of deployments. Kubernetes constantly compares the number of pods (replicas) requested with the number of pods instantiated. A difference between the two can be caused by a temporary scenario (an increase in the number of pods with Horizontal Pod Autoscaler), but if the condition persists, the application may be unable to respond to a load peak.
The second indicator to track is retries. A deployment might fail for several reasons, including a temporary situation. Detecting this, Kubernetes increments a “Retry” counter at the deployment level. A rise in this indicator may be a sign of a more ongoing situation. You then need to determine why. This is the starting point for a detailed diagnostic process that takes practice.
How to Track These Indicators?
Dashboards are the easiest way to track these metrics. Azure Container Insights is built into Azure Monitor and hence Azure. The solution has the benefit of being natively integrated with Azure and ready to use right out of the box.

Azure Monitor Container Insights (Microsoft)
An open-source solution like Grafana can be used to avoid dependency on a cloud provider. The solution is installed as an application in Kubernetes. The Azure integration is relatively quick, and numerous dashboards are already available for tracking our indicators, such as the one below:

AKS Grafana dashboard (Grafana)
More about Kubernetes
Building our Kubernetes platform involves numerous technical and organizational choices to fulfill the commitments made to the businesses. You must plan how the platform will operate once in production. Afterward, work will continue to meet new commitments. As mentioned in Container Month, we need to invest in observability for our platform and our applications. Read our white paper “Preparing for Kubernetes Adoption” for more information.
We also encourage you to read all the posts in our Run series, written in partnership with Squadra:
- 12 Factor-App: Modern Application Development Patterns
- How to Keep a Kubernetes Platform Up and Running?
Post co-written by Benoit Sautière (Cellenza) and Sébastien Dillier (Squadra)