
Developed by GitHub and OpenAI, professionals are calling GitHub Copilot a “revolutionary tool for developers,” since it combines Artificial Intelligence...
29 June 2021
Lire cet article en Français
What is Power BI?

Power BI is a business intelligence solution developed by Microsoft to allow companies to aggregate, analyze and view data from multiple sources.
More accurately, it is a set of software services, applications, and connectors that work together to turn unrelated data sources into immersive and interactive visual information.
Power BI’s strength is that it allows you to easily connect to and view your data sources, make important discoveries, and share this information with anyone.
There are three ways to access Power BI:
- Power BI Desktop: a Windows desktop application
- Power BI service: an online service
- Mobile apps: mobile apps for Windows, iOS, and Android devices
Power BI Desktop
Power BI Desktop is a free application you install on your local Windows computer. You can use it to connect to multiple different data sources, convert them, and combine them into a data model.
You can use that data model to create visuals and collections that you can share with other people within your organization in reports.
Power BI Desktop is traditionally used to compile reports about a user workstation. The Power BI service can then share these reports with other people.

Power BI Desktop Overview
The three Power BI Desktop views are:
- Report: Create reports and visuals
- Data: View tables, measures, and other data used in the data model associated with your report
- Model: Use this view to display and manage relationships between the tables in your data model
Connecting to Data
The first thing you need to do to get started with Power BI Desktop is connect to the data. Power BI Desktop offers a host of different connectors. The data sources are divided into the following categories: File, Database, Power Platform, Azure, Online Services, and Other.
To connect to data:
- In the Home tab, select Get Data > More.
The Get Data window opens, showing the wide range of categories available to connect to in Power BI Desktop. Select File > Text/CSV to import data.
- When you select Text/CSV, a window opens asking you to select a .csv file saved on your computer
- Once you have connected to one or more data sources, the aim is to transform that data into something relevant

There are two options when you import data:
- Import: This is the default method when creating a new data source. The imported data is stored on the disk. This method provides modelers with design flexibility and support for specific Power BI features (Q&A, Quick Insights, etc.).
- DirectQuery: An alternative method to Import. Models developed in DirectQuery mode do not import any data. They only import the metadata that defines the model structure instead. When you query the model, native queries retrieve the data from the underlying data source.
How To Transform and Clean Data/How To Create a Data Model
In Power BI Desktop, you can clean and transform data with the built-in Power Query editor. You can use the editor to amend data, such as changing a data type, deleting columns or combining data from multiple sources.
To start the Power Query editor:
On the Home tab, select Transform Data (transformer les données) in the Queries section.
The Power Query window appears as shown below:
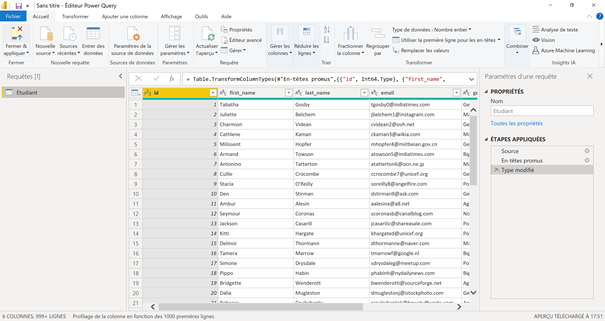
Every step you take to transform your data (for example: renaming a table, transforming a data type, or deleting a column) is recorded by the Power Query editor. These steps are performed every time the query connects to the data source.
After transforming the query, confirm your changes by clicking Close & Apply (Fermer & Appliquer):
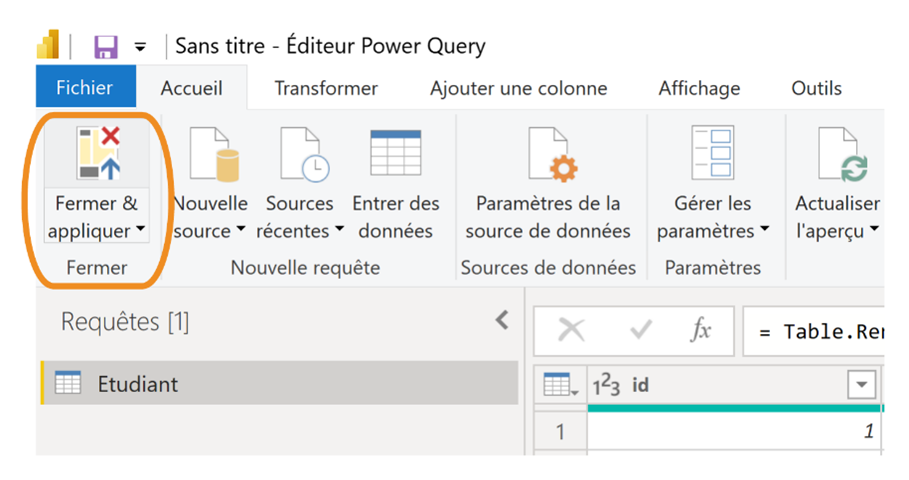
The query or queries you loaded will be visible as data models. You can then create links between your queries for analysis purposes as needed.

Sometimes, you will need to create measures and calculated columns to answer specific questions. Power BI uses the Data Analysis Expressions (DAX) language to create a measure or calculated column.
DAX is a collection of functions, operators, and constants that can be used in a formula or expression to calculate and return one or more values. It helps you create new information from existing data in your model.
Once you have cleaned the data and designed the model, it’s time to create your visuals. Power BI has several standard visual types in addition to a number of customized visual types you can add (for example, a chart rendered from D3.js, Python, and the Appsource).
To add a new visual:
- Go to the Visualizations tab and select the visual icon.

- Add the fields you want to view in the Values pane:
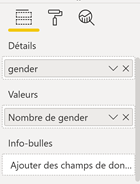
- You will see the following rendering:

You can add more visuals to create your first report:

When the report is ready to share with other users, you can publish it on the Power BI service and make it available to everyone in your organization with a Power BI license.
To publish a Power BI Desktop report, go to the Home tab and select Publish (Publier)
Power BI Desktop connects you to the Power BI service using your Power BI account. The report is then available in the Power BI service.
Power BI Service
The Power BI service is the Power BI cloud service. Use it to stay informed and share information from anywhere. This collaborative workspace lets you view and use Power BI content, such as dashboards and reports. You can also make simple changes to reports and collaborate with others.
You can also use the Power BI service to create workspaces (containing reports, dashboards, or datasets) and deployment pipelines.
Right now, let’s create a workspace and publish the report we created in Power BI Desktop.
To create a workspace:
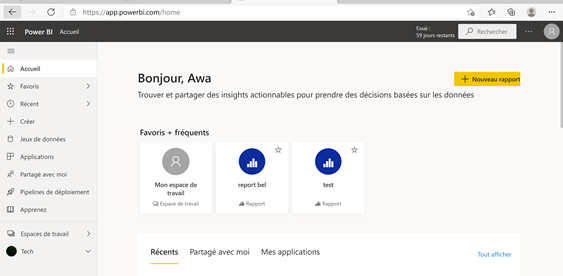
- Log in at https://app.powerbi.com/
- Select Workspace (espace de travail), then click Create a workspace (Créer un espace de travail) :

- Enter the workspace name (the name must be unique within your account) and description. The description helps you find the workspace again after you have created several.

Click Save (Enregistrer). You just created your workspace! It appears in the list of workspaces. Now you can publish the report you compiled earlier in Power BI Desktop to the workspace you just set up. You will then be able to share it with people inside and outside your organization (if you allow them to, those people can also share the report with their colleagues). Note: people outside your organization can view and interact with the dashboard or report but not share it.
How to share the report
- Open the report, click Share > Report (Partager > Rapport) and enter the email addresses of the people you want to share the report with. Add an optional message, then check or uncheck the sharing options as required.

Power BI Mobile
Power BI offers a number of mobile applications for mobile iOS, Android, and Windows devices. The reports and dashboards you created previously are available via Power BI Mobile.
You can define mobile-optimized views for visuals in Power BI Desktop by clicking View on the top ribbon, then Mobile layout:

Download the Power BI Mobile app and install it on your phone to access your reports and dashboards.
Want To Learn More About Power BI?
Intended to be a guide for beginners who want to find out more about Power BI, in this post we looked at the basic components of the Power BI suite:
- Power BI Desktop for creating reports
- Power BI service for sharing and collaborating with others
- Power BI Mobile for iOS, Android, and Windows 10 devices.
We’ll be back soon with the next in this series of posts on Power BI!