Introduction Integrating security into a widely used platform like GitHub is both a challenge and an opportunity to enhance its...
10 March 2022
Lire cet article en Français
Azure’s Native Run Tools
Post co-written by David Frappart (Cellenza) & Florent Hilger and Sébastien Leroy (Squadra)
With the current maturity of Cloud platforms, production environments have inevitably arrived.
The first step was to digest the cloud model embedded in these platforms and adapt “legacy,” or non-cloud, architectures to these new platforms.
Now it’s time to move on to the next step: mastering cloud operations.
We’ll try to provide some clarifications and pointers in this article to help you achieve this goal, specifically on the Azure platform.
We won’t claim to be able to cover everything in one post, so we’ll focus on the following topics:
- First, starting from the basis that the Run is defined by knowing which operations must be performed, we’ll of course cover observability.
- Next, we’ll look at application protection concepts, specifically backup and recovery.
- Finally, we’ll describe our current approach based on our wealth of experience.
Observability Tools in Azure
Because the cloud has changed the way architectures are designed, it’s only natural that observability has also been affected.
Fortunately, the Azure platform natively has a rich and extensible ecosystem, allowing you to connect third-party observability systems.
Speaking of observability, we’ll need to define metrics and collect logs. Logs allow us to track system errors and define error rates, among other things. Metrics provide valuable information like website latency or microservice saturation.
We’ll also need alerts or dashboards to keep track of these logs and metrics.
Metrics
Azure Monitor Metrics provides access to metrics in Azure. According to the Microsoft documentation, they can support “near real-time scenarios” due to their lightweight nature.
Metrics can be explored on a live resource by navigating to the “Metrics” menu and adding the desired metric.

Metrics in Azure Monitor
Initially, this is a simple way to configure resource observability.
Once out of exploration mode, you can use the Azure documentation to get all the metrics available for a resource type.
Microsoft.ContainerService/managedClusters
| Metric | Exportable via Diagnostic Settings? | Metric Display Name | Unit | Aggregation Type | Description | Dimensions |
| apiserver_current_inflight_requests | No | Inflight Requests | Count | Average | Maximum number of currently used inflight requests on the API server per request kind in the last second | requestKind |
| cluster_autoscaler_cluster_safe_to_autoscale | No | Cluster Health | Count | Average | Determines whether or not cluster autoscaler will take action on the cluster | No dimension |
| cluster_autoscaler_scale_down_in_cooldown | No | Scale Down Cooldown | Count | Average | Determines if the scale down is in cooldown. No nodes will be removed during this time frame | No dimension |
Sample of Azure platform metrics
It’s possible to create alerts or generate a dashboard to aggregate the metrics of a subset of targeted resources based on certain predefined thresholds (more on this in the “Alerting” and “Dashboarding” sections).
Logs
Let’s now look at the logs.
We have three types of logs:
- activity logs
- resource logs
- the third log type isn’t really a log type at all because it’s the Azure Active Directory logs
To summarize, we can use this table from the Azure documentation:
| Log | Layer | Description |
| Resource logs | Azure Resources | Provide insight into operations that were performed within an Azure resource (the data plane), for example, getting a secret from a Key Vault or making a request to a database. The content of resource logs varies by the Azure service and resource type.
Resource logs were previously referred to as diagnostic logs. |
| Activity log | Azure subscription | Provides insight into the operations on each Azure resource in the subscription from the outside (the management plane) in addition to updates on Service Health events. Use the Activity Log to determine the what, who, and when for any write operations (PUT, POST, DELETE) taken on the resources in your subscription. There is a single activity log for each Azure subscription. |
| Azure Active Directory logs | Azure Tenant | Contains the history of sign-in activity and audit trail of changes made in the Azure Active Directory for a particular tenant. |
Description of Azure log types
To dig deeper into the Azure resource logs, which are also collected in Azure Monitor Logs, we need:
- native resource logs
- logs and performance data collected by virtual machine agents
- application logs collected with Application Insight
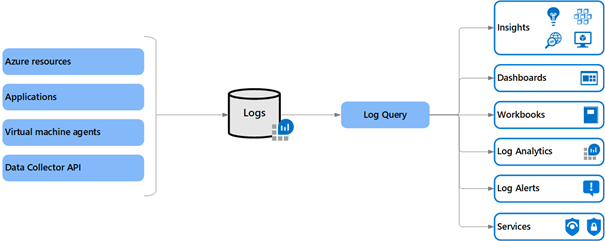
Details of resource logs
Except for activity logs, which are available for three months directly from the Azure portal, all other logs are available if you enable them in the Diagnostic settings.
We can specify the storage location when configuring this collection:
- An Azure storage account
- A Log Analytics workspace
- An Event Hub
- Third-party solutions available on the Azure marketplace

Azure resource log configuration

Log type and possible destination in Azure
The storage account is typically used for long retentions and is relatively inexpensive.
The Log Analytics workspace lets you query the logs directly using Microsoft’s Kusto Query Language (KQL). However, the cost of ingesting logs makes it unsuitable for long-term retention.
The most common use of an Event Hub is to send logs to external systems.
Recently, the ability to add partner solutions available on the marketplace has been added. This can be an appealing option for lowering the cost of implementing a new tool (for example, switching from a known query language to Kibana vs. KQL).

Partner solution compatible as Azure log destination target
Alerting in Azure Monitor
Azure Monitor can, of course, set up alerts.

Configuring alerts in Azure Monitor
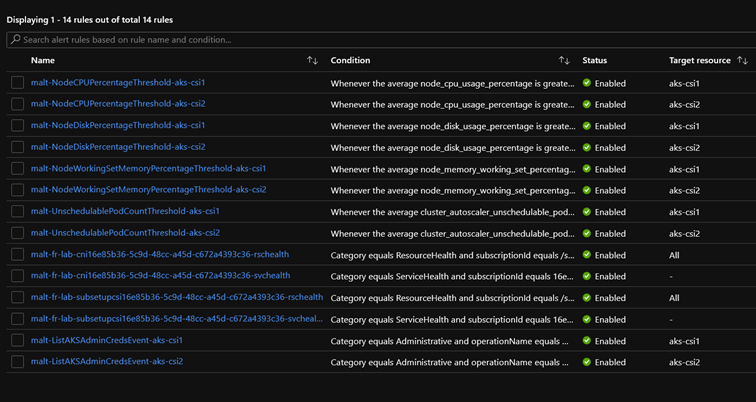
Sample Azure alerts

Available signals for Azure alerts
These alerts are based on metrics and activity log conditions. However, custom alerts based on KQL queries can be configured for logs ingested in a Log Analytics workspace.

Sample rule based on a KQL query
These alerts must be accompanied by an Action Group that determines the alert notification method. These notifications can be sent via email or through Logic apps, Azure functions, or webhooks.

Actions available in an Action Group
Dashboarding in Azure Monitor
Apart from simple notification, visualizing a system’s status is also important for managing operations. You can, of course, connect Azure Monitor to third-party dashboarding solutions.
However, dashboards can also be created in Azure directly. These objects behave like Azure resources in that they can be assigned access via Role-Based Access Control (RBAC) roles.
To create one, simply select a metric and click “Pin to Dashboard.”
A KQL query can be written from a Log Analytics workspace to generate charts that can be used to enrich a dashboard.
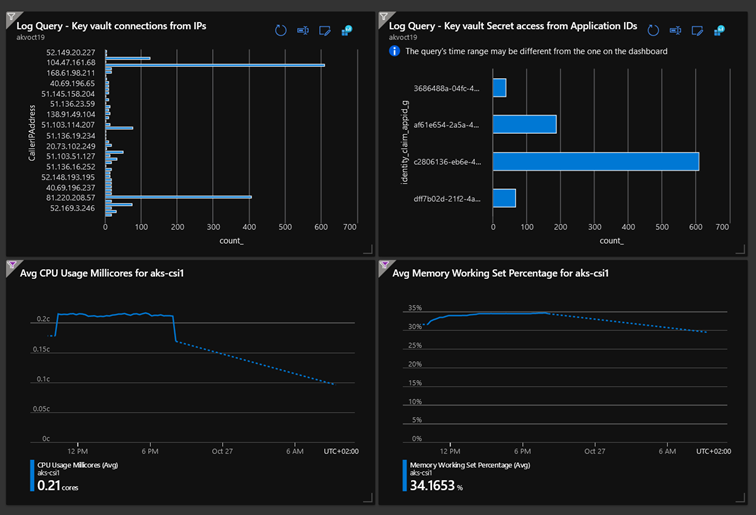
An example of a dashboard created using metrics and KQL queries
It’s worth noting the existence of libraries of workbooks, either built-in or customized, made up of templates of specific KQL queries and capable of providing a graphical rendering either from the workbook menu of a resource or via the “Pin to Dashboard” button to supplement a view.

Some workbook templates

AKS workbook
Lastly, exporting dashboards gives you the option of industrializing their creation.
Protecting Resources in Azure
When considering operations, we also think about backup and restore. Like monitoring, most PaaS solutions provide data protection configuration options. For example, an Azure Database for MySQL server can be configured with automated backups and Point in Time Restore options.
In some cases, the backup will rely on native solutions such as Recovery Service Vault, which under certain conditions supports the protection of virtual machines (VMs) in Azure or elsewhere, but also storage accounts such as Blob or Files, or, more recently, Azure Database for PostgreSQL.
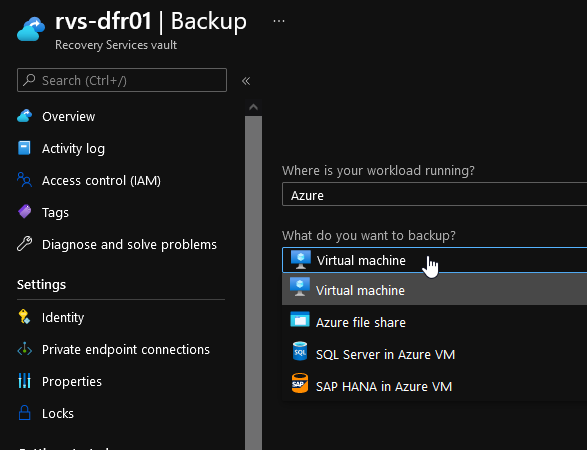
Recovery Service Vault
Prepare Operations from the Design and Build Phases
Observability
The adoption of infrastructure as code is a natural consequence of cloud adoption.
When resource logs with alerts that are cloud resources by nature are configured, they can be configured via infrastructure as code (IaC) and included in the build.
The log destination will be the fundamental building block for configuring the resource logs. Remember that the possible destinations are:
- storage accounts
- Log Analytics workspaces
- or Event Hubs
Therefore, these are Azure resources that can be configured via infrastructure as code.
Whether it’s a global log destination for an Azure subscription or a subset of resources, defining the log source during the upstream, landing zone, or Azure project phases is critical.
Example of an Azure Monitor database metric configured in Terraform
To summarize:
- In the design phase:
- Define the signals that indicate a cloud platform’s/application’s state
- Define metric alerts for the above indicators
- Define resource logs to supplement these indicators
- Define destinations for these logs
- Define and standardize relevant dashboards and workbooks
- In the build phase:
- Create the Azure Monitor alerts defined in design
- Configure each resource’s log destination
- Create KQL-based alerts if needed
- Create dashboards from templates
Backup
If an Azure architecture brick has a native protection solution, the configuration of that protection can be added, as can additional Azure resources like Recovery Vaults and associated backup policies as needed. As with Azure Monitor, the choice of shared or subscription-based protection services must be made during the design phase.
Example of a Terraform configuration with resource protection
Example Terraform backup policy configuration
Run in Azure: The Essentials
A word from Squadra, an Azure Run expert:
Run is the process of keeping the services implemented by the Build in operational condition. So, for the Run to be effective from the start of the project, it must be considered during the Build phase. Applying this to the automotive industry, it would be like entering the 24 Hours of Le Mans and hoping to win without any technical support, logistics, parts, or a driver.
This means workshops must be held alongside construction to determine KPIs, key infrastructure metrics, alerts, and relevant countermeasures. For example:
· Maintenance window that could affect the user service
· Adding a Software Development Kit (SDK) to the Azure web service to obtain metrics
The Run teams should conduct these workshops with all participants, especially the application managers. These application managers can determine their own critical KPIs (excluding infrastructure).
A well-defined Run allows you to be proactive and make more targeted improvements (e.g., capacity planning). Teams of “runners” must constantly monitor the components and adapt them to the customer’s context as the editor or application changes.
All projects must use DevOps to maintain efficiency between the Build and the Run. With these mechanics, we can adapt to changes as they occur, thereby ensuring maximum availability.
We have seen in this post that Run in Azure can rely heavily on platform native solutions.
We also stressed the importance of defining indicators and tools for protecting Cloud assets as early as possible to prepare for cloud operations in IaC mode.
However, we have only scratched the surface of the Action Group topic, which can be used to integrate remediation or responses to automated events beyond simple notification.
Would you like to learn more about how the Build affects the Run? See our new series of posts on the subject: