Introduction Integrating security into a widely used platform like GitHub is both a challenge and an opportunity to enhance its...
24 March 2022
Lire cet article en Français
Azure Integration Platforms: Why, Which Aspects, and How to Monitor Them?

Post co-written by Joan Lumia and Samir Kamlichi (Cellenza) & Florent Hilger and Sébastien Leroy (Squadra)
With the rise of cloud solutions, digital transformation issues, hybrid architectures, and so on, integration platforms still have an invaluable role to play. Integration platforms are, by definition, at the heart of an organization’s information system and, as such, are crucial to the smooth running of the company.
Cellenza believes that monitoring, KPI analysis, and continual improvement are essential to an integration platform’s success. It covers all aspects of these issues.
APIs in the Integration Platform
APIs now play a critical role in modern integration platforms. The number of APIs within information systems is increasing due to digital transformation projects, APIzation, and the need to consume data faster.
Within your integration platform, APIs will play:
- either an input gateway role: source partners will be able to push data and/or retrieve its processing status; or
- an output gateway role: APIs will allow the various backends to recover data (raw or modified) stored in their respective databases.
Given how vital these components are, it’s essential to address the issues of monitoring, analysis, and Run during the platform’s design stage.
From an infrastructure perspective, monitoring APIs in Azure follows a four-step process:
- API metrics
- Alerts
- Activity logs
- Resource logs
Two API metrics are important: capacity, which helps size the API, and requests, which allow us to analyze the traffic passing through it with feedback to help spot problem areas.
The alerts will be based on metrics to trigger actions such as email, SMS, push notifications, and phone calls.
The activity logs are crucial: they allow us to identify “who, when, what” quickly.
Finally, resource logs are mainly used in debugging sessions. They help us track the operations performed on the Azure resources.
But it’s also important to look at these issues from a functional and business point of view. Using data from the monitoring tools, we try to measure:
- API use: which APIs are being used? How many requests?
We also look at who is consuming the APIs. Some of Cellenza’s clients are keen to identify API consumers so they can consider monetizing their APIs and, by extension, their core business.
- API availability
Are the APIs up or down? This information is of significant value to our clients from a technical and business point of view. The goal here is to tell at a glance if critical APIs are available or not and to measure any impact this may have. Decision-makers can use this data to assess the work and urgency required to fix the problem.
- API adoption
KPIs that measure API activity are also used to gauge API adoption levels. Are our APIs being used? Are they finding their consumers? If yes, what can we learn from these figures to continue to improve the API experience? If not, why not? Is the API documentation up to date and relevant?
- Error types and frequency
How many errors does the platform generate? How can we categorize these errors? Are these technical or functional errors inherent in the quality of the data received? It’s critical to be able to generate reports tracking this type of data while keeping in mind that one of the challenges of modern integration platforms is continual improvement.
We can also use tools like Azure WorkBooks or Power BI to create dashboards that present all this information to the Run teams:

The Modern Integration Platform and Its Components
Similarly, we try to monitor each component of the modern integration platform, such as Service Bus, Logic App, Data Factory, Azure Function, etc. As with the APIs, we monitor from an infrastructure standpoint to ensure everything is up and running and from a business standpoint to aid decision-making and continual improvement.
For example, our Logic Apps, which allow us to create separate workflows based on an item or event, may be useful.
In case of problems, it’s imperative to check two things:
- Execution histories to determine the execution status and see if any of the steps are causing issues
- Triggers that indicate whether an action has been completed
Alerts should be placed on failed triggers. This allows you to be informed fast and correct the situation quickly.
Another example: particular attention should be paid to ensure the proper functioning of Service Buses, which are fully managed “enterprise message distributors” and must be monitored just like any other component.
Metrics analysis is the first step toward estimating the Service Bus load. To make interpreting the Services Bus activity logs easier, we recommend you use Kusto queries to identify elements of the following types:
- Management operations in the last X days
- Audit logs from the last hour
- Key vault access
- Errors over a specific period
- Etc.
You can also generate alerts based on this feedback to rectify the situation quickly.
The important thing is that the application, Build, and Run teams communicate with one another to alter metrics as needed in order to be as responsive as possible.
A Customized Functional Monitoring System: IntegrationCockpit
To supplement the three aspects of use, availability, and performance, we offer our customers IntegrationCockpit. This is a customized monitoring tool created by Cellenza based on feedback from our customers for complete 360° monitoring of an integration platform.
This solution, offered to our customers as a software accelerator, provides high levels of effective functional monitoring and highlights three key issues:
- Business-oriented: having a common understanding, breaking out of black box syndrome, and improving the integration platform’s performance
- Generalized to all integration platform exchange types, Azure Integration Platform as a Service, BizTalk Server, or Hybrid
- Keep It Simple Stupid for Dev and Ops
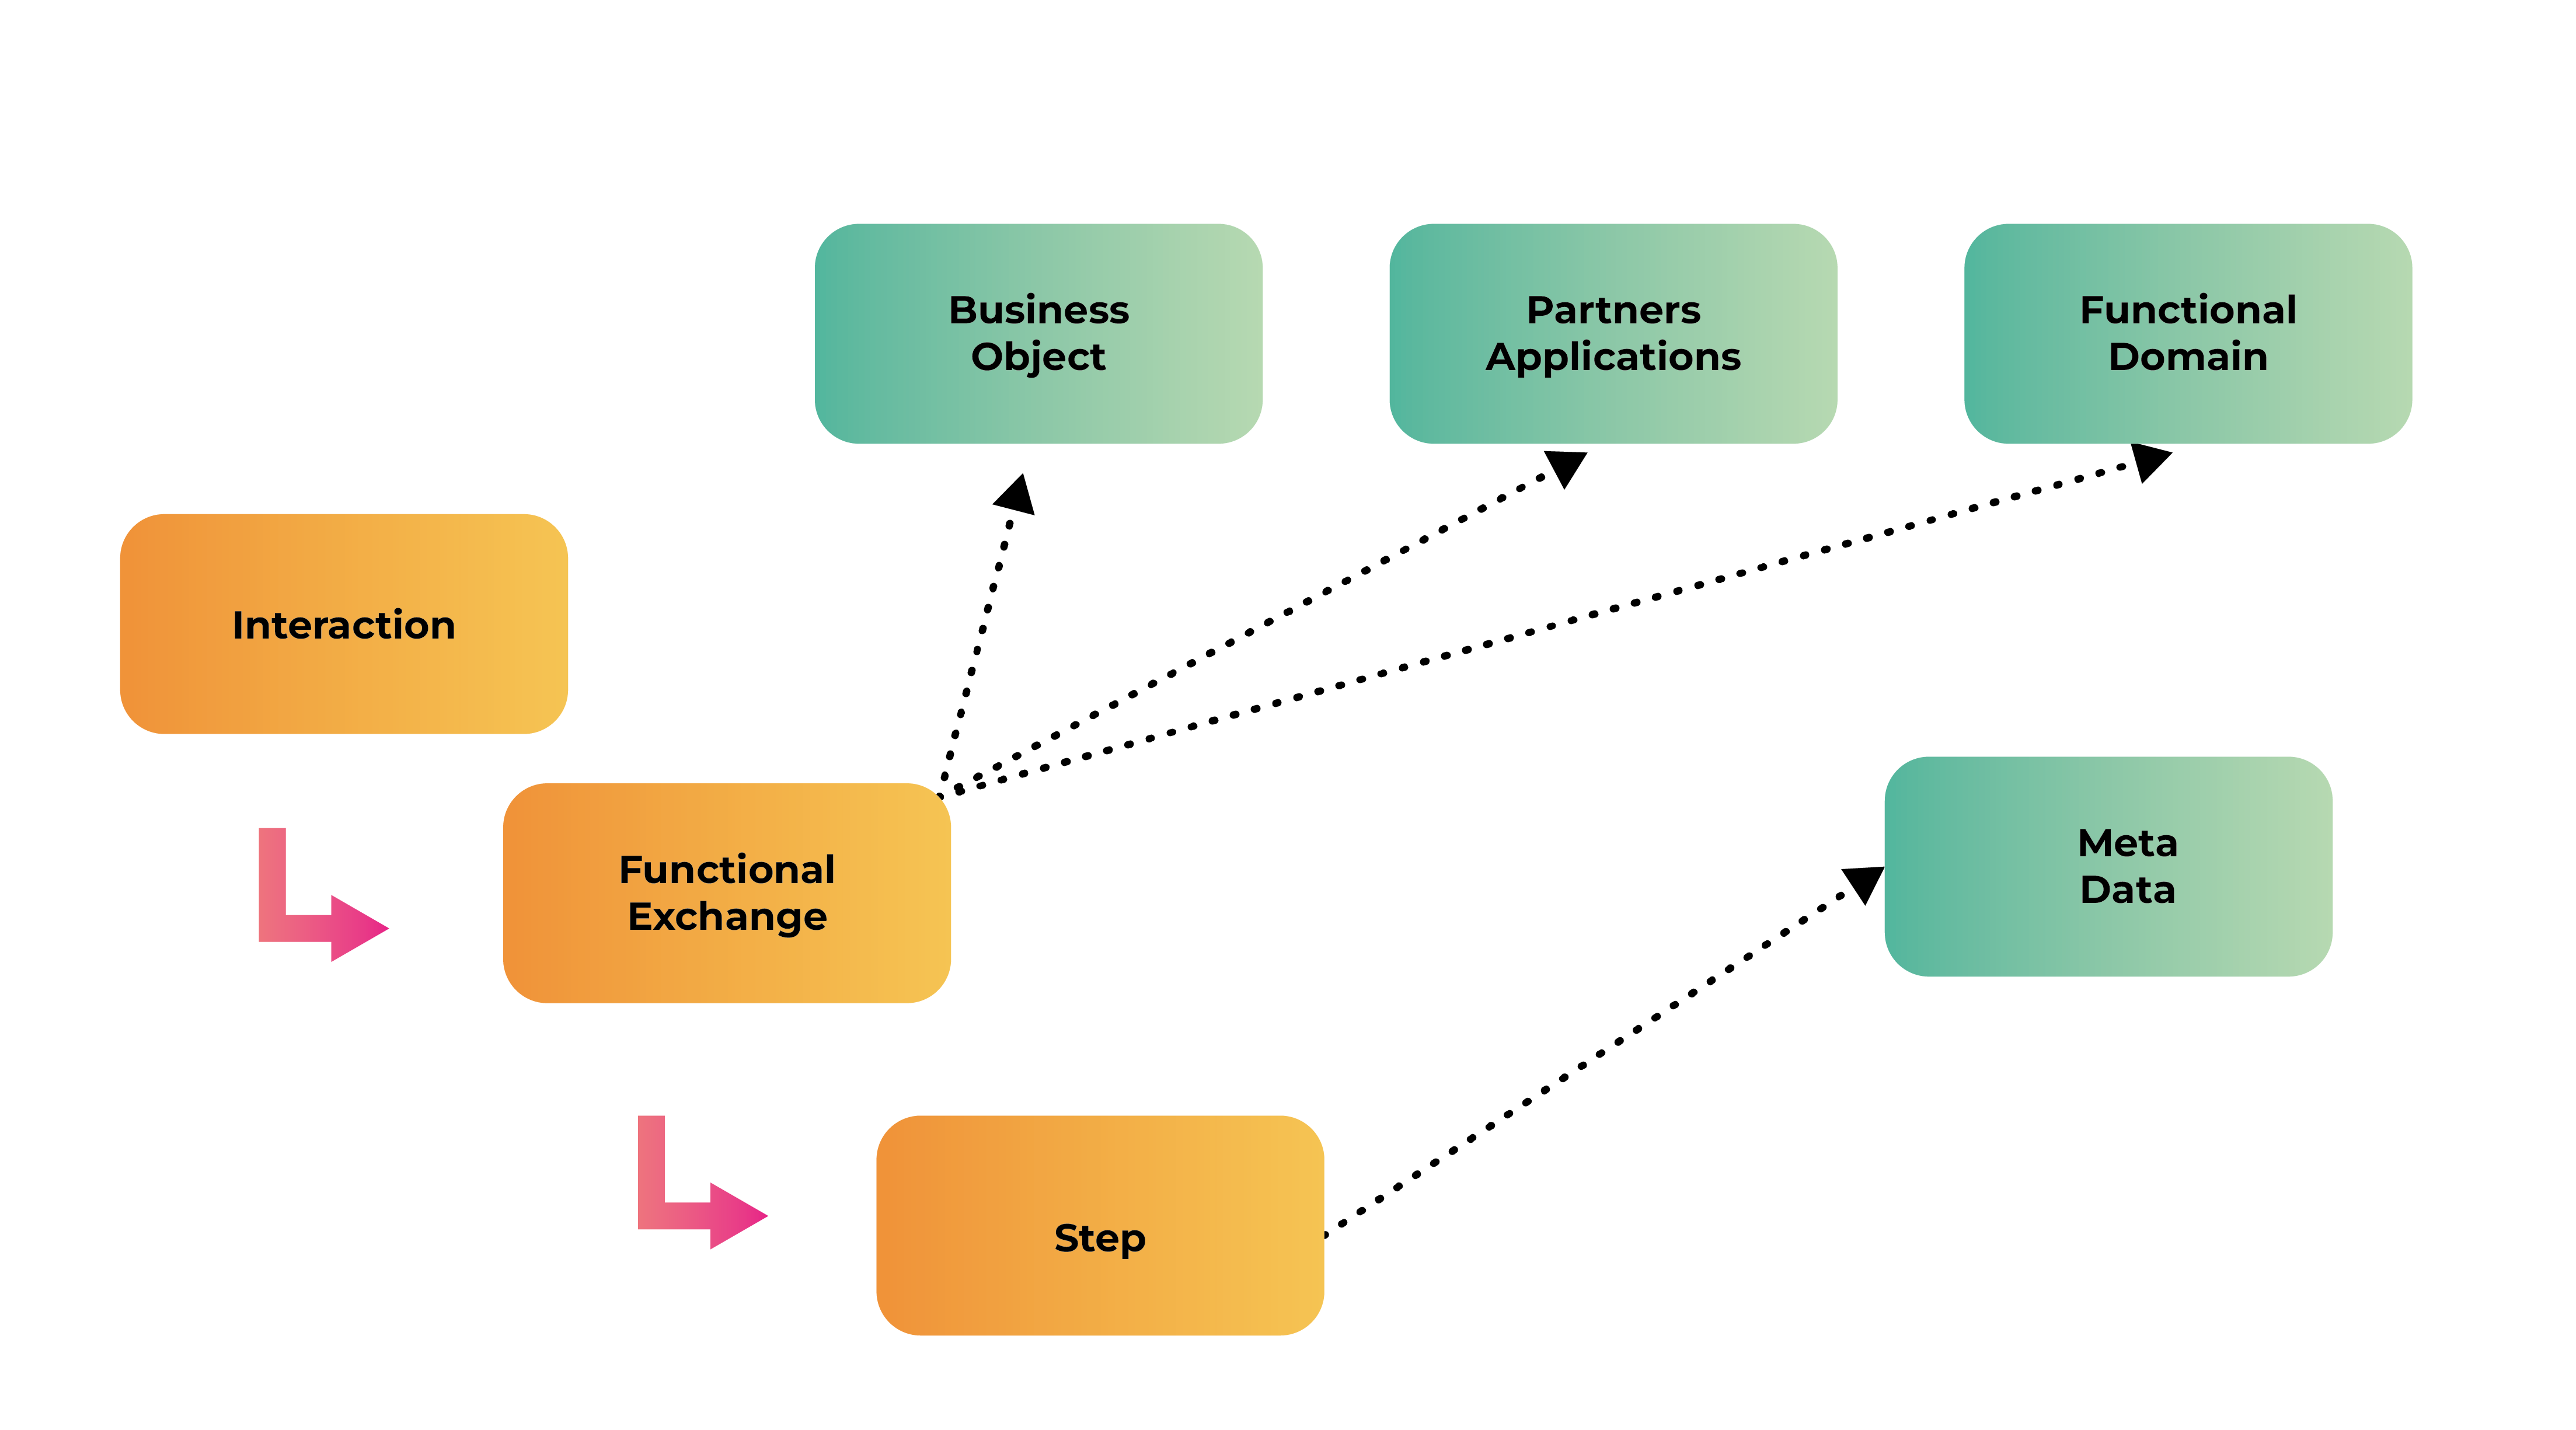
Cellenza has developed a monitoring meta-model based on four main objects to address these three issues:
- Functional Domain
- Business Object
- Partner App
- MetaData
The diagram below shows a simplified view of the meta-model:
The IntegrationCockpit Features
IntegrationCockpit collects, models, and presents useful information in the IntegrationCockpit portal. The program also handles alerts in the event of errors or SLA violations.
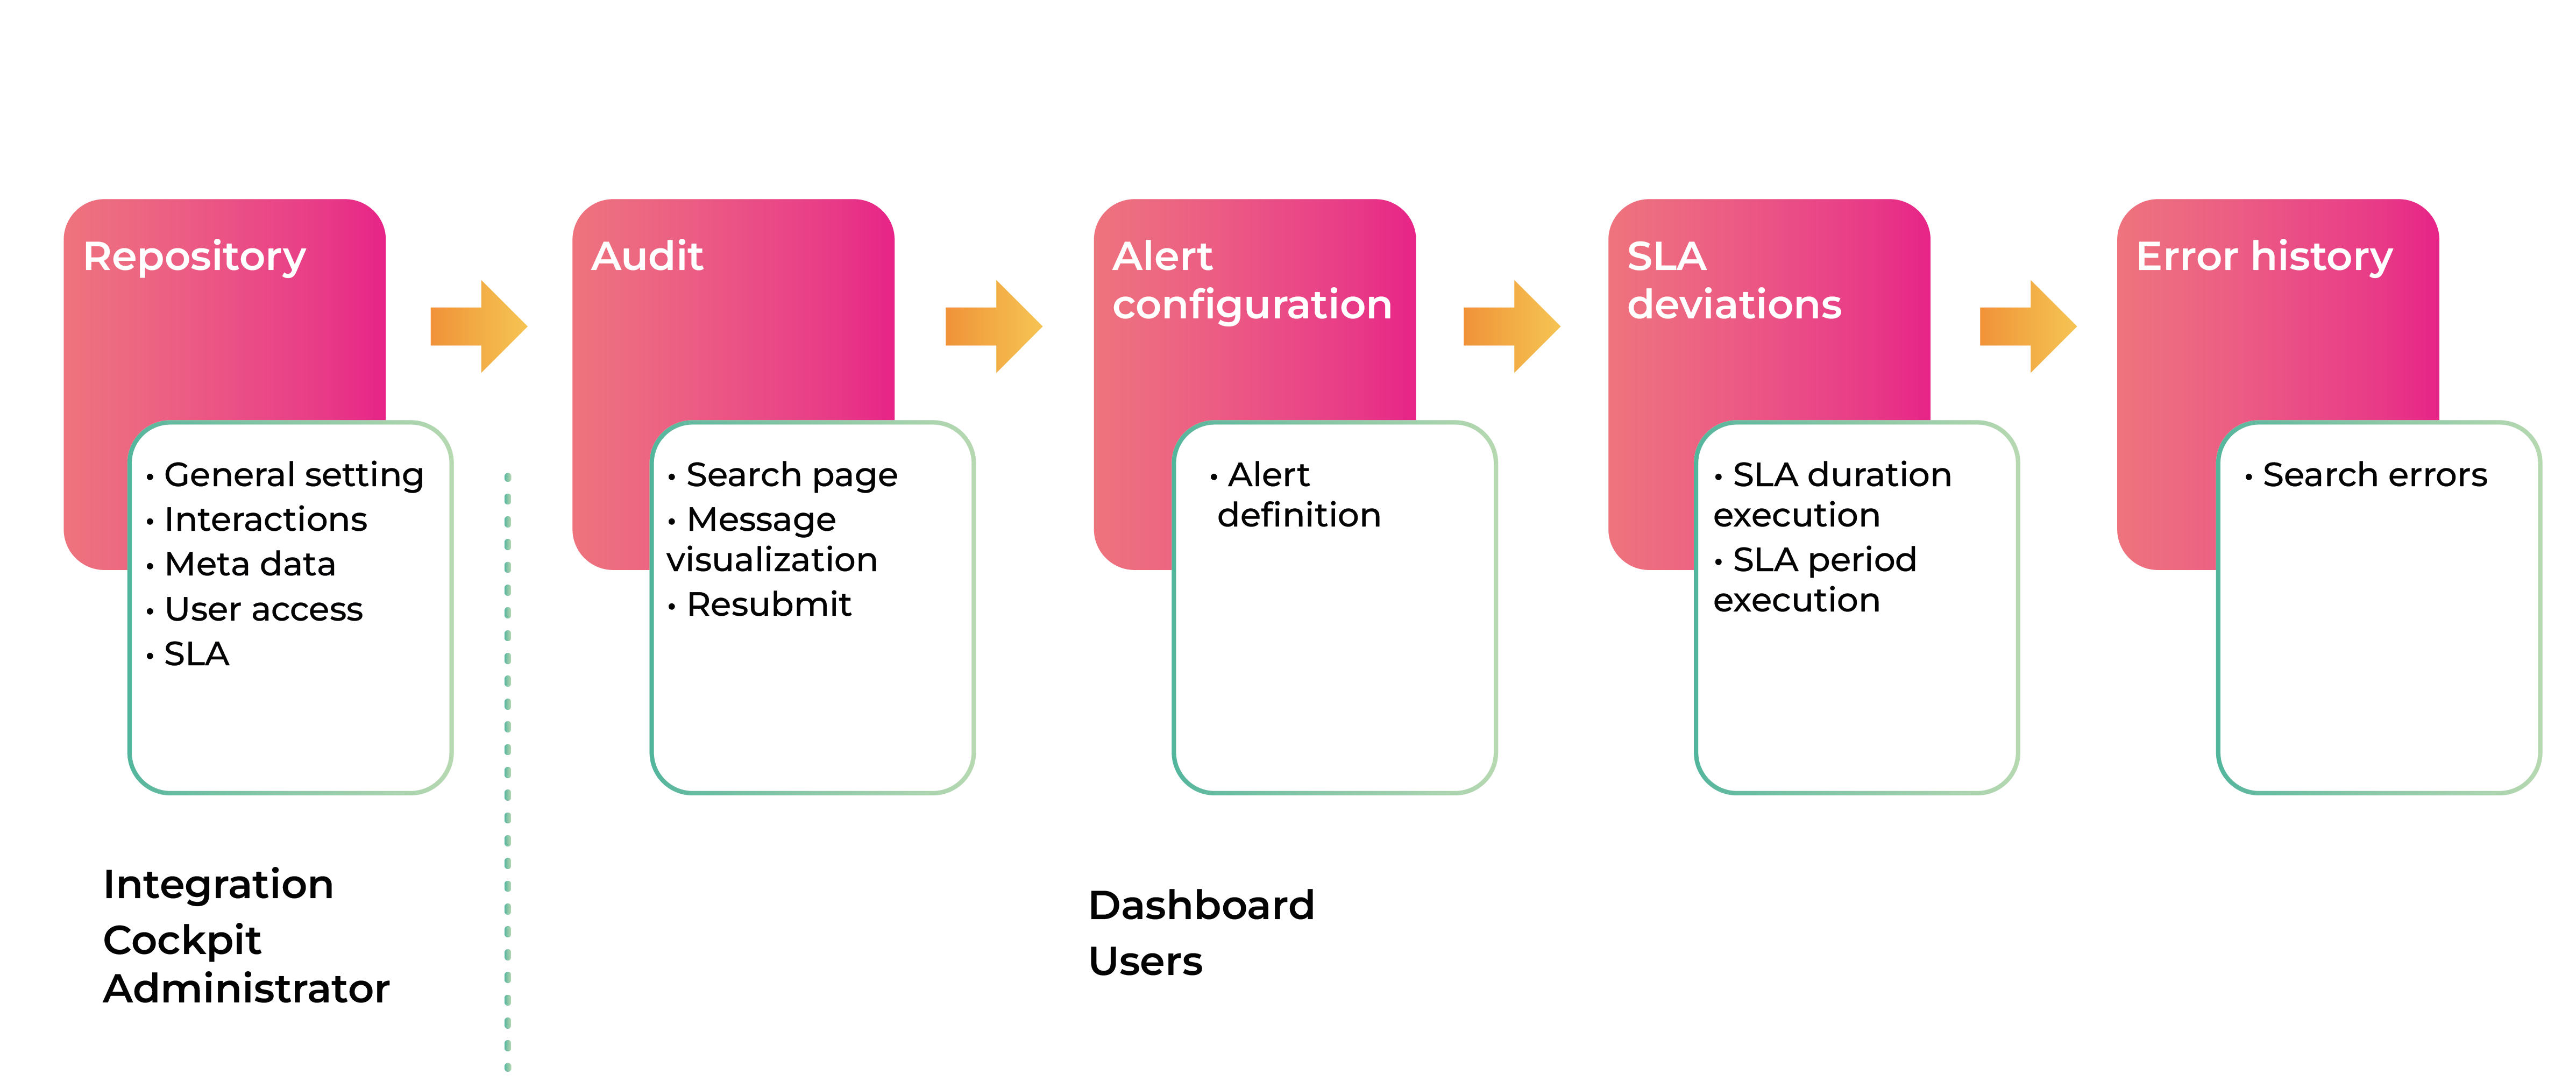
These features are organized across five tabs:
- Repository: for defining and registering functional domains, business objects, partner applications, and user access rights management. Administrators can access this tab.
- Audit: for finding exchanges using filters.
- Alert Configuration: for configuring and creating alerts based on the whole interaction or a functional exchange part of an interaction.
- SLA Deviations: for defining alerts based on execution time or period.
- Error History: for finding errors.
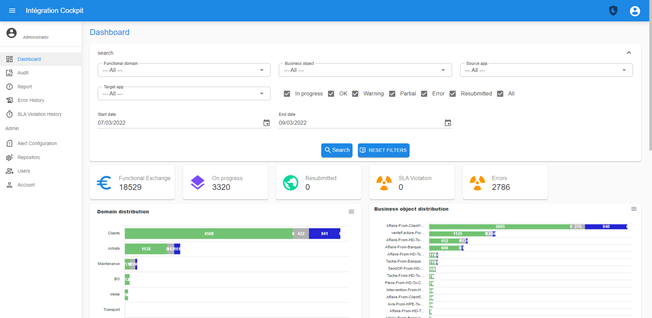
IntegrationCockpit Portal
In the IntegrationCockpit Portal, you will see the Dashboard tab. This includes:
- Charts showing activity over the last few days:
- Chart showing functional exchanges with different states
- Chart showing functional domains with different states
- Chart showing the number of executions for each functional exchange
- Chart showing the number of errors for each functional exchange
- Summary tables:
- Functional exchanges table showing the total number of executions and the number of execution errors
- Table of errors generated over the past 24 hours
- Table of SLA violations over the past 24 hours

- Search criteria: we can search for exchanges:
- by functional domain
- by functional exchange
- by state
- by date
- with the ability to save selected search criteria (except the date)
- Table of results by:
- functional domain
- functional exchange
- state
- start date and end date
- a link to the functional exchange details

- Functional exchange details
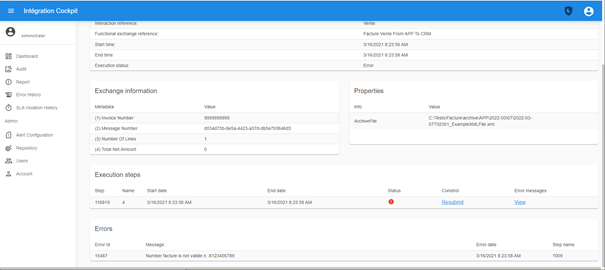
- Error alerts: an email alert is sent in the event of errors in functional exchanges to which the user has subscribed.
- SLA violation alerts: an email alert is sent in the event of an SLA violation in functional exchanges to which the user has subscribed.

- Execution reports: an email report (CSV file with all lines) is sent for the executions performed the day before in the functional exchanges to which the user is subscribed.
Modern Integration Platform Monitoring: Key Takeaways
As with any component identified as critical in information systems, special attention must be paid to monitoring of the platform’s modern integration. Our components need to be monitored in terms of infrastructure: are the bases and services up and running? Are they accessible? Functional? But also in terms of functionality: what is the status of my XV324 order? What is the status of my streams? Why is this error occurring?
With this in mind, Cellenza decided to go one step further and provide its own monitoring solution, enhanced by the expertise and experience of its integration experts: IntegrationCockpit. To learn more about this solution, please contact Cellenza.
Squadra, a Run expert, also underlines the need to incorporate these issues early in the platform design process and for communication between the application, Build and Run teams so that metrics can be adjusted on a continual basis for greater responsiveness.
For more information, please see all our posts created in partnership with Squadra during Run Month:
- 12 Factor-App: Modern Application Development Patterns
- How to Keep a Kubernetes Platform Up and Running
- Kubernetes: Building a Platform with Run in Mind
- Azure’s Native Run Tools
- AI Project Run: Managing the Life Cycle of an ML Model
- Data Observability
- Which Metrics Should You Be Tracking for your Mobile Application?
- OpenTelemetry: .NET Instrumentation in the Future
Post co-written by Joan Lumia and Samir Kamlichi (Cellenza) & Florent Hilger and Sébastien Leroy (Squadra)